ADVERTISEMENT

Running back transfer Walker making strong early impression (link)

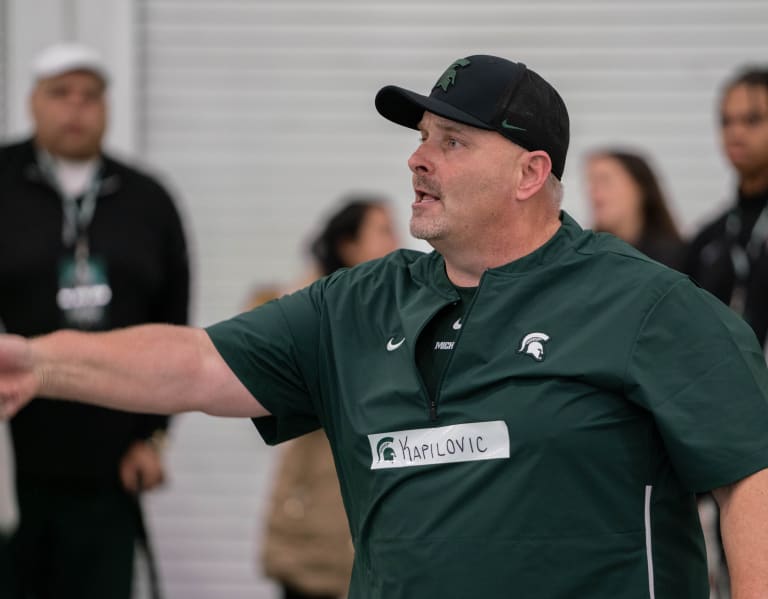
Here is my story on run game and Kenneth Walker with quotes from Kapilovic. I've heard a lot of good things about Walker from people I know who cover the ACC. He's gonna help out a lot.

MEN'S BASKETBALL Dr. G&W Analysis: Breaking Down the Sweet 16

Basketball season may be over for the Michigan State Spartans, but the NCAA Tournament will be continuing with the Sweet 16 this coming Saturday. After the bracket was released, I presented my detailed analysis of the bracket and made some math-based predictions about how the first weekend and entire tournament might play out.

While it would be more fun to write about a potential MSU-Alabama matchup in the Sweet 16 (which might have actually come to fruition had the Spartans simply boxed out properly on a rebound in the final seconds of the First Four contest against UCLA) it is still fun to reflect on the results of the first weekend and to take another math-based looked at the remaining tournament field. If nothing else, in the great words of Coach Mark Dantonio, it is time to “complete this circle.”

Let’s start with a review of the wild action of the first two rounds.

Results of Rounds One and Two

In my analysis of the bracket, I presented data that showed that the average number of upsets to expect in the first round of the NCAA Tournament is eight, and is the second round, that number is five. When I looked at the projected odds for each of the first round and projected second round games, I identified a few matchups with better than average odds for an upset.

Based on this analysis, I made a historically average number of upset picks and then carried this analysis through to the Final Four and eventual champion. In the real tournament, there were an above average number of seed upsets in both rounds (10 in first and six in the second to be exact). Table 1 below summarizes my upset picks and the actual upsets through two rounds.

Table 1: Summary of NCAA Tournament upset picks and upset results through two rounds
20210324%2Bupsets.jpg


Of the 13 total upset predictions that I made this year, a total of six were correct, two I give myself partial credit (marked with a yellow “O”) and five were wrong. There were eight additional upsets that I did not pick. On balance I think that my method did OK.

The biggest success was that I correctly predicted one of the biggest upsets of the weekend: No. 14 Abilene Christian’s upset win over No.3 Texas. I also picked No. 13 Ohio to upset No. 4 Virginia. I am also giving myself credit for taking UCLA/MSU to beat BYU, even though I was clearly thinking that it would be the Spartans and not the Bruins to win both of those games. Most office pools take the First Four winner as either/or, so it still counts in my book. Hey, there has to be some benefit of the First Four, right?

The other partial credit comes from the fact that I correctly bounced No. 3 West Virginia and No. 4 Oklahoma State in the second round, I just had the triumphant opponent wrong. From an office pool point of view, this also has some value.

As for a more visual view of the upsets, I repeat below one of the main figures that I used to make picks last week, with the actual upsets highlighted in bold, red text.

20210324%2B1st%2Band%2B2nd%2Bround%2Brecap.jpg

Figure 1: 2021 odds for the first round games compared to the average historical odds for each seed pair

From a certain point of view, in retrospect, my analysis perhaps did a better job than I originally thought. Of the 32 total first round games, only eight contest clearly fell below the average line, which denotes a more likely upset. Five of those games ended in an upset and Liberty and Colgate were both very competitive in their games. It was only the LSU versus Saint Bonaventure game that bucked this trend and I didn’t even make that pick.

I probably should have more seriously considered the possible Purdue upset by North Texas, but I decided to ignore the warnings of my own analysis. As for the other five upsets, three of them (Maryland, Syracuse, and UCLA) all lie close to the average line.

Only two of the 10 first round upsets were truly surprising: Oregon State and Oral Roberts. As for Oregon State, the Beavers’ upset of Tennessee perhaps could have been predicted had I simply remembered that head coach Rick Barnes was on the bench for the Volunteers and he is absolutely notorious for losing to lower seeds. As for Ohio State, my math suggests that upset on the No. 1 and No. 2 line are simply random bad luck. It’s happened to the best of us...

Figure 2 gives a similar retrospective analysis of the second round games.

20210324%2B2nd%2Bround%2Brecap.jpg

Figure 2: 2021 odds for second round games compared to the average historical odds for each seed pair

As for the predictability of the six second round upsets, the results are less clear. In total, seven of the 16 games had above average upset odds and only three of those games ended in upsets. In this case, I did correctly pick USC’s upset of Kansas and West Virginia’s loss, but Texas Tech and Maryland (actually UCONN) let me down on the upset front.

It is also clear that I let my belief in the strength of the Big Ten cloud my analysis a bit. The data did suggest that Wisconsin had a shot to beat Baylor, and that was the pick that I made. BUT, the data suggested that Loyola-Chicago beating Illinois was actually more likely. If I couple that with the in-state rivalry aspect (similar to my analysis of Texas and Abilene Christian) then perhaps I should have seen than one coming. My faith in the Big Ten also caused two of my Final Four picks: Illinois and Ohio State to be knocked out very early.

As for the other three upsets, the Oregon State/Oklahoma State game was right on the average line, but Iowa and Florida both had better than expected odds to avoid an upset. Once again, you win some and you lose some.

How Mad Was It?

Based on a few different measures, such as the number of double-digit upsets, the 2021 NCAA Tournament looks to be one of the most chaotic tournaments on record. That said, measures like just counting double-digit seed underdogs are not very mathematically precise. Fortunately, there is a better way to compare the relative madness of different months of March.

In order to quantify the relative likelihood of a specific first and second round outcomes in any given year, one just needs to know the odds of each individual game outcome. You can then multiple those probabilities together to get the overall odds.

Fortunately, I happen to have just these odds, as derived from Kenpom efficiency margin data. In fact, these are exactly the numbers that I use to run my Monte Carlo simulations. I also happen to have performed the same calculation on each NCAA Tournament back to the beginning of the Kenpom era (2002).

The result tell me that the odds for the specific first round outcome in 2021 were:

1 in 81.5 million.

That is on the high side. The first round odds in 2013, 2016, and 2018 were similar in magnitude, but a little lower. The geometric average since 2002 is one in around five million. However, there is still one other year, 2012, that still holds the record for the least likely first round outcome at:

1 in 800 million.

This was the year where both Duke and Missouri were upset as No. 2 seeds by No. 15 seeds Lehigh and Norfolk State respectively. The year 2012 also had 10 total first round upsets, including a No. 4 seed and two No. 5 seeds. However, the second round in 2012 recorded only two additional upsets, and the odds of the specific outcome after two rounds was “only”

1 in 1.3 trillion.

This is actually slightly lower than the odds after two rounds in 2018 when No. 1 Virginia was upset in the first round by No. 16 UMBC, and then the second round saw the upset of a second No. 1 seed (Xavier) and half of the No. 2 seeds (Cincinnati and North Carolina). The odds of seeing the exact scenario in 2018 were:

1 in 1.8 trillion.

But, that pales in comparison to the tally from 2021. The qualitative estimates are, in fact, correct. The odds that I calculate for the current tournament results after two rounds are:

1 in 6.5 trillion.

which are the longest odds of the Kenpom Era by a factor of three, and much higher than the geometric average of one in 30 billion going back to 2002.

Analyzing the Sweet 16

So, what’s next? With 16 teams remaining it is time to wipe the slate clean and try to make some new predictions about how the rest of the tournament will play out. I will start with the results of a new Monte Carlo simulation of the remainder of the tournament.

Table 2: Monte Carlo Simulation results starting form the Sweet 16
20210324%2BS16%2Bsim.jpg


I decided to keep the pre-tournament Kenpom efficiency values in this case, so I don’t want to get too hung up on the details. What this tells me is that Gonzaga is still a heavy favorite to win it all (43 percent) and that the Zags have about a 75 percent chance to reach the Final Four.

Then, there are three teams next in line with similar odds to cut down the nets: Michigan, Houston, and Baylor (around 13 percent odds each). Each of those teams is 50-50 to advance to the Final Four. Then, there is a group of dark horse teams (Loyola-Chicago, Alabama, Arkansas, USC, and Villanova) with between two and five percent odds to win the Title.

I also included a column in this table labeled “normalized final four odds.” This is my attempted to estimate the relative ease or difficultly of each teams path to the Final Four. The calculation involves estimating the odds of each team to advance to the Final Four if they were only as good as a benchmark team with an efficiency margin of +19.00 (an average high-major team).

Higher percentages mean an easier path, which is the case for Arkansas and Houston, as they both will face double-digit seeds in Oral Roberts and Syracuse, respectively, in round three. On the opposite end of the spectrum is Creighton (who will face Gonzaga). The Blue Jays grade out to have the most difficult remaining path.

As for potential upsets to look out for in the next few rounds, Figure 3 below compares the odds in each contest relative to the historical average for each given seed combination. This is essentially the same analysis shown above in Figures 1 and 2.

20210324%2BS16%2Bpicks.jpg

Figure 3: 2021 odds for the Sweet 16 games (left) and potential regional final games (right) compared to the average historical odds for each seed pair

In this case, for the Sweet 16 games, I am using the odds from the actual opening Vegas lines, as opposed to the Kenpom projected odds. For the region final round (Figure 3, right) I revert back to the odds from Kenpom.

Based on both the original simulation results and the expected value calculations, two upsets are expected in the Sweet 16 round. Based on the left panel of Figure 3, the most likely upsets are for No. 1 Michigan to lose to Florida State and No. 6 USC to lose to No. 7 Oregon.

That said, USC actually has better odds than an average No. 6 versus No. 7 seed matchup, which makes me balk at that pick a little. The next most likely upset would be for No. 11 Syracuse to beat No. 2 Houston, which just feels annoyingly correct. If this were to come to pass, Jim Boeheim would surpass Tom Izzo with the most upset wins in NCAA Tournament history at 16. Dislike.

As for the regional final round, the odds suggest one out of the four games will end in an upset. On the right panel of Figure 3, I compare the teams under the assumption that the higher seeds all advance. In this scenario, the most likely upset in No. 8 Loyola to beat No. 2 Houston (if the Cougars can solve the Syracuse zone). After the beat-down that the Ramblers gave to the Illini last weekend, I would totally buy that.

If I were to start again from the Sweet 16 round, I believe that I would take Florida State and Syracuse to win, and then just the top seeds in the next round, which would give me a Final Four of:
  • No. 1 Gonzaga
  • No. 1 Baylor
  • No. 8 Loyola-Chicago
  • No. 2 Alabama
Alternatively, I could see Oregon beating USC, but Houston beating Syracuse. I would take the same Final Four in both scenarios.

This Final Four is a reasonable distribution of seeds and I think that it is total reasonable based on the eyeball test from last weekend. I would take Gonzaga over Alabama, and then I will take a flyer on Loyola to upset Baylor before succumbing to the machine that is Gonzaga.

That is all for today. Enjoy what is left of March Madness and as always, Go Green.

HOCKEY The NHL isn't messing around....

I missed this last night though I did see part of the game, but the NHL just banned one of the officials that did the Wings-Preds game last night:


I know he was retiring, but still....

Recruiting why

I am just curious as to why we struggle to get top 4 star 5 star talent in some positions. I mean it’s good we get in on some and I love our kids don’t get me wrong but honestly if I was a 5 star O or D lineman I’d choose State. Not because I love them but because A we’ve put kids into the NFL from both lines. B. I see the talent and say to myself I can compete and play early. C. Big Ten tv exposure. I got a chance to stand out. Not be a 5 star 3rd on the chart behind 2 other 5 stars. I’d think we would be an attractive school to these player but we just don’t seem to close them out. Why is this

MEN'S BASKETBALL Well... that was quick

We are exactly five games into the First Round and I already lost a Final Four team. Sorry folks! Math has failed us... the curse of Mackey Arena does not figure into the algorithm.

Here is a bizarre tidbit:

Oral Roberts is the 5th No. 15 seed to advance since 2012. In 2 of the previous 4 occurrences, Florida was in the same half of the bracket and advanced to Regional Final. One of the other 4 occurrences was when Duke also got upset, and the Gators can only play in one region at a time. The only time the Gators did not directly benefit was in 2016... which we will not discuss.

ORU will face No. 7 Florida on Sunday.

Weird.

MEN'S BASKETBALL Dr. G&W's Bracket Analysis, Part Two: Using Math to Make the Picks

(OK, everyone, here is my detailed break down of the bracket. Just as a note, many of you know that I also publish my stuff on another fan website where I am a staff writer. As a courtesy to them, I usually always post there first and then I put the content over here as well, usually just a few minutes later. Tonight, I decided to give all of you a sneak preview, as this piece is not scheduled to go live until 8 AM tomorrow. At that point, it will not be behind the Rivals pay wall, so you are certainly welcome to share that version... unless of course you want to keep the knowledge all to yourself. Regardless, enjoy!)

As tip off to the 2021 NCAA Basketball Tournament approaches, serious and casual fans of the sport have likely already made at least one attempt to fill out a bracket for their office pools. Before you make that final submission, I have a bit of advice for you.

In the first post of this two-part series, reviewed the historical patterns in NCAA Tournament upsets and explained the mathematical underpinnings of why those patterns exist. With this information, we know why the chaos exists and what a “typical” NCAA tournament bracket should look like. But, we still do not know how to apply that know-how in order to truly dominate our office pools.

Well, you are in luck, dear reader, as I am about to give you the keys to the castle.

As I alluded to in part one, NCAA tournament results can be predicted to some extent based on point spreads, and point spreads can be estimated using efficiency data, such as the values published by Kenpom. If we combine this knowledge with the baseline information of how a typical tournament usually plays out, it gives us a chance to identify where the most likely upsets will happen.

To this end, I will now take a closer look at the 2021 bracket from two angles. First, I will give an overview of each region. Second, I will go round-by-round and provide recommendations on the most likely picks, based on the data. Let’s start with the West Region.

West Region

For each region, I will present one figure and one table to provide an overview of what we can expect to see on the hardwood. Figure 1 below compares the Kenpom adjusted efficiency margin for the 18 teams in the West relative to the historical average Kenpom efficiency of teams with the same seed. This tool is very useful to quickly see which seeds in the region are weak or strong, relative to historical averages.

20210317%2BWest%2BKP.jpg

Figure 1: Analysis of the 2021 West Region based on Kenpom adjusted efficiency margins, compared
to the historical averages

At a first glance, a few key things stick out from Figure 1. First, Gonzaga is really, really good, and Iowa is also a very strong No. 2 seed relative to historical averages. As for the rest of the region, USC stands out as a strong No. 6 seed and No. 15 Grand Canyon has a very strong efficiency margin for a team seeded that low. It likely won’t matter, but that is interesting.

Table 1 below gives the Monte Carlo simulation results for the 18 teams in the West Region.

Table 1: Simulation results for the 2021 West Region, compared to historical averages
20210317%2BWest%2BTable.jpg


This table and the one that will follow contain a ton of information. In the left-most section is the current Kenpom efficiency margin for each team. Next to that column is the Kenpom efficiency margin relative to the historical average efficiency margin for teams with that seed. This is essentially the same data plotted in Figure 1.

For example, Gonzaga is actually entering this tournament with the best efficiency margin on record since 2002 when reliable Kenpom data is available. The Zag’s margin of +38.05 is 9.31 larger than the historical average efficiency margin of all previous No. 1 seeds.

In the middle section of the table is the results of the Monte Carlo simulation of the full tournament utilizing Kenpom efficiencies to project point spreads and single game odds. The number is each cell is the odds for that team to advance to the round shown in the column heading.

My simulation predicts that the Gonzaga Bulldogs have an 80 percent chance to reach the regional final, a 63 percent chance to reach the Final Four, and a 37 percent chance to win the National Championship. Note that these odds are the best of any team on record and slightly better than the odds for the 2015 Kentucky team (35 percent) who held the previous record.

That said, these numbers are somewhat meaningless without context. That is where the final section of the table comes in on the far right. These odds are the odds for each team to advance to each round relative to the odds for an average team of that seed in a tournament filled with other historically average teams.

For example, according to Kenpom, the Iowa Hawkeyes are a strong No. 2 seed. As a result, Iowa’s odds to make the Sweet 16 are 8.5 percent better than an average No. 2 seed and their odds to make the regional final are 11.5 percent better than average. However, due to the presence of Gonzaga in the half of the region, the Hawkeyes have a below average (by two percent) chance to make the Final Four.

Note that I have also sorted the teams in Table 1 according to their odd to win the region (i.e. advance to the Final Four). Already, we can start to see the main dark horse team emerge: USC. Despite being just the No. 6 seed and having only the fourth best Kenpom efficiency in the region, the Trojans have the third best odds to make it to the final weekend.

South Region

Figure 2 below gives visual summary of the 16 teams that make up the South Region and it is followed by the simulation results table.

20210317%2BSouth%2BKP.jpg

Figure 2: Analysis of the 2021 South Region based on Kenpom adjusted efficiency margins, compared to the historical averages

Table 2: Simulation results for the 2021 West Region, compared to historical averages
20210317%2BSouth%2BTable.jpg


As Figure 2 and Table 2 show, almost every team in the South Region, with the exception of No. 12 seed Winthrop, is above average for their seed. A few teams, such as No. 5 seed Villanova, No. 6 Texas Tech, No. 11 Utah State, No. 13 North Texas, No. 14 Colgate, and especially No. 8 and No. 9 seeds North Carolina and Wisconsin are noticeably above average.

On balance, the South looks like a strong region, which is depressing Baylor’s odds to make it to the Final Four. In particular, Baylor’s second round game against the winner of the Wisconsin / North Carolina game could be a potential upset. In addition, on paper, Villanova looks to be the most likely dark horse in this region.

That said, this is the perfect time to mention the obvious caveat to this analysis and methodology. Kenpom efficiencies are simple averages of a team’s performance over the entire year. In the case of Villanova, they had a key injury late in the season when Collin Gillespie torn his MCL, and they have not played well since. As a result, we cannot trust the numbers associated with Villanova in Table 2, in my opinion.

Midwest Region

Continuing on to the Midwest Region, Figure 3 and Table 3 summarize the key metrics for the teams in that region.

20210317%2BMidwest%2BKP.jpg

Figure 3: Analysis of the 2021 Midwest Region based on Kenpom adjusted efficiency margins, compared to the historical averages

Table 3: Simulation results for the 2021 Midwest Region, compared to historical averages
20210317%2BMidwest%2BTable.jpg


According to Figure 3 and Table 3, the teams that look to be more dangerous than usual are No. 8 Loyola, No. 9 Georgia Tech, No. 2 Houston, No. 6 San Diego State, and No. 16 seed Drexel.

On the flip side, this bracket also seems to have a few potential weak links in No. 3 West Virginia and No. 4 Oklahoma State. Also, No. 12 Oregon State and No. 14 Morehead State are below average for their seeds as well.

In general, this looks like a sneaky tough road for the Illini. The boys from Champaign are an above average No. 1 seed, but the odds for them to make the Final Four are barely above average. In the first round, they draw an above average No. 16 seed in Drexel, and after that, they have to face the winner of the No. 8 / No. 9 seed game between Loyola and Georgia Tech, who are both well above average for their seed.

In they survive until the regional final, it is more likely that they will meet No. 2 seed Houston who Kenpom currently estimates as the strongest of the No. 2 seeds and the most likely one to win the National Title. In addition, No. 5 seed Tennessee also looks to be above average and a possible dark horse.

In a normal year when all teams have played a full non-conference schedule, I think that the analysis above would be pretty solid. However, I do have some doubts as to whether mid-major teams like Houston and Loyola are actually as good as their current Kenpom averages suggest. If they are, Illinois might be in some trouble.

East Region

Finally, let’s take a look at the East Region.

20210317%2BEast%2BKP.jpg

Figure 4: Analysis of the 2021 East Region based on Kenpom adjusted efficiency margins, compared to the historical averages

Table 4: Simulation results for the 2021 East Region, compared to historical average
20210317%2BEast%2BTable.jpg


Similar to the South Region, most of the teams in the East look to be above average, relative to the historical values. The main exception is No. 3 seed Texas.

As shown in Figure 4, it is the teams in the middle of the seed list, notably UCONN, Saint Bonaventure, LSU, and Maryland, along with No. 14 seed Abilene Christian, who are prime candidates to cause trouble.

Looking at the Final Four odds in this region, Michigan has the best odds on paper, which are actually better than an average No. 1 seed. However, with the injury to Isiah Livers and another potentially tough match-up in the second and third rounds, I have my doubts that the Wolverines will live up to expectations.

Furthermore, No. 2 seed Alabama and No. 3 Texas also look to have lower than usual odds to survive the region. In total, this tells me that the East Region is the most likely one to descend into Madness, resulting in a team seeded lower than No. 3 making it to the Final Four. Right now, I like Florida State’s odds.

As for Michigan State’s chances, their odds to advance are clearly depressed by the fact that the Spartans have to play an extra game in the play-in round (which I do not explicitly handle in the comparison to historical averages). That said, I project that MSU has only a 14 percent chance to make it past BYU, only a five percent chance to make it to the Sweet 16 and less than a one percent chance for a magical run to the Final Four.

That said, these simulations are assuming that Michigan State is only as good as their Kenpom averages suggest. We have seen long odds before this season and we made the tournament anyway. If MSU can play close to their ceiling of potential, I do believe that they can make a run. But, the numbers do not currently support that idea.

Picking the First Round

Now that we have taken the full tour of each region, it is time to start making picks. In order to inform these decisions, I have taken the data presented above and converted it to a different format. In this case, I am calculating the odds of an upset for each first round match-up and comparing those odds to the simulated odds based on the historical averages. The result is shown below in Figure 5.

20210317%2BRound%2B1.jpg

Figure 5: Projected upset odds for each first round seed combination relative to the historical averages.

Now we are getting somewhere useful. From Figure 5, we can clearly see which upsets in each pairing are more likely than average (the ones below the blue line) and the ones that are less likely (the ones above the line).

Starting with the top seeds, as expected there are no clear first round upset picks for the No. 1 and No. 2 seeds. For the No. 3 seed, however, things get interesting, as both Texas and Arkansas have been paired with stronger than usual No. 14 seeds in Abilene Christian and Colgate.

For the interest of full disclosure, I should say that I have done some math which suggests that it is never a good idea to pick a team seeded No. 3 or higher to get upset in the first round. After all, the odds for Texas to win are still 75 percent. In the case of Colgate, they played such an abbreviated schedule that I simply don’t trust the validity of their Kenpom efficiency anyway.

But Abilene Christian over Texas? I am very, very tempted to make that pick, especially since my analysis suggests that Texas would likely lose to No. 6 BYU in the next round anyway (if they make it that far). If you are feeling bold and want a good “big” first round upset, that is the one that this analysis suggests.

As for the No. 4 seeds, there is no clear upset recommendation on this line this year. Purdue and Oklahoma State have slightly lower odds than usual, but not by much. If I were to make a recommendation, however, this is a case where the intangibles might play a leading role. Virginia had to back out of the ACC Tournament due to COVID issues and their roster status seems to be in question. If a No. 13 seed is going to win this year, my pick is for Ohio to beat the Cavaliers.

As for the No. 5 seeds, this frankly looks like a bad year for the famous No. 5 / No. 12 upset. The No. 12 seeds all look weak this year and the No. 5 seeds are relatively strong. It might make sense to pick Villanova to lose without Gillespie, but Winthrop is a very weak No. 12 seed. My pick is for Big East Tournament Champs No. 12 Georgetown to upset No. 5 Colorado. The current Vegas lines also support this pick as the most likely.

There are also no clear upset picks on the No. 6 seed line. USC looks safe, but the other three teams could run into trouble. Of course, the best outcome would be for MSU to knock off BYU after defeating UCLA. That projects to be the second most likely upset on this line, second only to Utah State over Texas Tech. History tells us that one of two of these games is a likely upset.

On the No. 7 seed line, there is a very clear upset recommendation: No. 10 Rutgers to take out No. 7 Clemson. The current Vegas line also has the Scarlet Knights favored, so this is perhaps the best upset pick of the entire first round. As for the other games, Kenpom has the Oregon / VCU game as the next most likely upset pick, but the Vegas line suggests otherwise. The other two games do not inspire me to select an upset winner, but it would not shock me to see Maryland beat UCONN.

Finally, the No. 8 / No. 9 games are always a coin toss and the Kenpom data and Vegas lines are just causing confusion. Based on Figure 5 (from Kenpom) taking Wisconsin and Saint Bonaventure as “upset winners” makes the most sense. But, the Vegas lines favor the No. 8 seeds across the board, so this is a tough call. Personally, I like Wisconsin and Georgia Tech to win as No. 9 seeds, but that is more of a gut feeling.

In summary, I like the following first round upset picks
  • No. 14 Abilene Christian over No. 3 Texas
  • No. 13 Ohio over No. 4 Virginia
  • No. 12 Georgetown over No. 5 Colorado
  • No. 11 Utah State over No. 6 Texas Tech
  • No. 11 MSU over No. 6 BYU (total homer pick)
  • No. 10 Rutgers over No. 7 Clemson
  • No. 9 Wisconsin over No. 8 UNC
  • No. 9 Georgia Tech over No. 8 Loyola-Chicago
As I demonstrated in part one of this series, eight total first round upsets is exactly on the historical average.

Picking the Second, Third, and Fourth Rounds

An analysis of the second, third, and fourth round games can be done using the same general strategy. Figure 6 below compares the odds for each projected match-up, relative to historical averages. In this case, I still make the comparison to the seed combinations assuming that the higher seeds won in the first round.

20210317%2BRound%2B2%2Band%2B3.jpg

Figure 6: Projected upset odds for the second (left panel), third, and fourth round (right panel) seed combination relative to the historical averages.

The seed combinations for the second round games are shown in left panel. Based on this analysis, this is where the Madness of March is likely to rear its beautiful head. As discussed above, all of the No. 1 seeds, with the exception of Gonzaga, may have a problem in the second round. Based on this analysis, Illinois is the team that is most likely to lose.

That said, Illinois is playing pretty well right now, I am not convinced that Loyola is as good as Kenpom suggests, and I think Illinois can handle Georgia Tech. If a No. 1 seed is to lose in the second round, I think the either Baylor (with their lingering COVID issues) or Michigan (with their injury situation) are most likely. In my bracket, I have senior-laden Wisconsin knocking out Baylor, and Michigan barely escaping LSU.

Figure 6 above suggest to me that we will see multiple upsets of No. 2 and No. 3 seeds in the second round in 2021. History suggests that one No. 2 seed usually fails to make it to the second weekend and this analysis suggests that Alabama is the most likely victim in 2021. I like the winner of the UCONN / Maryland game a lot in this upset.

As for the No. 3 seeds, this analysis suggests that they all might fail to make the Sweet 16. In my bracket, I have already knocked Texas out in the first round, and I think West Virginia and Kansas will follow in the second round. The only saving grace is that I have Arkansas facing No. 11 Utah State instead of No. 6 Texas Tech, otherwise, I would knock out the Razorbacks as well.

The No. 4 / No. 5 game is basically also a coin toss, but is this case, I already have No. 4 Virginia and No. 5 Colorado eliminated, so No. 5 Creighton and No. 4 Florida State should advance easily over the double-digit opponents. I don’t see short-handed No. 5 Villanova beating No. 5 Purdue, so that just leaves No. 4 Oklahoma State versus No. 5 Tennessee. Kenpom actually projected that the Volunteers would be favored in this match-up, so that is my pick as well.

In summary, my recommended second round upsets are:
  • No. 9 Wisconsin over No. 1 Baylor
  • No. 7 UCONN over No. 2 Alabama
  • No. 6 USC over No. 3 Kansas
  • No. 6 San Diego State over No. 3 West Virginia
  • No. 5 Tennessee over No. 4 Oklahoma State
Once again, I am hitting the average number of upsets in round two (five) exactly on the nose. I should also note that in my bracket, I have No. 11 Michigan State taking care of upstart No. 14 Abilene Christian to make it to the Sweet 16 where the Spartans would face No. 7 seed UCONN. You’re welcome.

Turning now to the Sweet 16 and Elite Eight, if the brackets went all chalk, the right panel of Figure 6 shows the relative odds for each match-up. Basically, once we get to the Sweet 16, the 2021 tournament is expected to be better behaved.

If Baylor were to make it this far, the figure suggests that Purdue would have the best chance to eliminate a No. 1 seed. Since I already knocked out the Bears, I have No. 4 Purdue beating No. 9 Wisconsin to reach the regional final.

The math suggests that a second No. 1 seed often loses in the Sweet 16 round and as Figure 6 suggests, the next most likely upset is for No. 4 Florida State to eliminate the Wolverines. The remaining Sweet 16 games would project to go to the highest remaining seed (including MSU losing and Ohio State winning), but I will throw a small veto into the math. I have No. 6 USC upsetting No. 2 Iowa.

In my bracket, this leaves:
  • West Regional Final: No. 1 Gonzaga versus No. 6 USC
  • South Regional Final: No. 2 Ohio State versus No. 4 Purdue
  • Midwest Regional Final: No. 1 Illinois versus No. 2 Houston
  • East Regional Final: No. 4 Florida State versus No. 7 UCONN
In general, I think that chalk would prevail here, as is often the case. But, the closest call is the Midwest region final, where Houston would only be a slight underdog to the Illini. As I mentioned in part one, Kenpom data suggests that the three most likely champions are Gonzaga, Illinois, and Houston, and I think that the National Title game will most likely involve two of those three teams.

As for me, I still like the Illini to advance and beat Ohio State (again) in the Final Four. I then see Gonzaga beating the Illini is an exciting finish to the 2021 season.

So, there you have it. Based on all the available data, when I turn the mathematical crank, that is the answer that I get. That said, any model and analysis is only as good as the data that feed it. This year, we have less data than usual, and we simply don’t know what we don’t know.

The last time we had a tournament, a similar analysis made some very accurate predictions. There is no guarantee that will happen again in 2021. So, please take everything above with a grain of salt. As I stated in part one, the Madness is predictable, on average. 2021 is no average year. But, the Madness is back, and that is all that matters.
MEN'S BASKETBALL Dr. G&W's Bracket Analysis, Part 1: Upset Odds Overview

(Note that this is only part 1 of 2. The is the appetizer of the full bracket analysis with my advice, which should come later this afternoon or this evening. This sets the table)

The calendar says March, and for sports fans, that means that the Madness has arrived. I have never been that interested in gambling (despite my fascination with the predictive power of the Vegas spread) but every year at this time, I make sure to enter as many online March Madness and office pools as I can.

Over the years, I never had that much luck. I did well a few times, but most years my picks flamed out early. But recently, as my interest in sports analytics increased, I developed a certain strategy to make my picks. In 2019, this new methodology worked very well.

It correctly predicted that Virginia would win the National Title. It predicted that No. 4 seed Auburn was a dark horse Final Four team, and it suggested that the winner of regional final games between No. 1 seed Duke and No. 2 seed Michigan State and No. 1 Gonzaga and No. 3 seed Texas Tech would likely join Virginia and Auburn in Minneapolis.

What I have learned from years of studying the NCAA Tournament is that while the event is chaotic, the chaos is fairly predictable, on average.

The reason that tournament games are predictable is that the odds of an upset follow the same “rules” as any other college basketball game. That is, the odds of an upset can be predicted based on the point spread. Furthermore, since the structure of the tournament tends to pair teams together with a similar historical relative strength (i.e. spreads), the “chaos” tend to follow a pattern of sorts.

While Vegas spreads are only available for first round games, predictive tools such as Kenpom efficiencies allow us to project spreads for any arbitrary NCAA Tournament matchup. With these tools in hand, it is possible to both simulate the full tournament and to understand where the upsets are more (or less) likely to occur.
Overall Upset Probabilities

Before we start to break down the 2021 bracket, it is important to understand the way that a typical NCAA bracket progresses. As an introduction, let’s first take a bird’s-eye view of the total number of upsets to expect in each round. Figure 1 below presents this data. Note that in all cases, an “upset” refers only to relative seeds of each team and not the Vegas line in any particular game.

20210316%2Bupsets%2Bby%2Bround.jpg

Figure 1: Average number of seed upsets per round projected from a simulation of the 2021 Tournament, the averages from the last 18 Tournaments, and the actual number of upsets

There are three different sets of data here that all give similar information. In blue is the number of upsets per round predicted by my most recent simulation of the 2021 NCAA Tournament. In red is the average number of upsets per round from the set of simulations of all past tournaments back to 2002 (when Kenpom data is easily available). Finally, the green bar shows the average number of actual upsets in that same set of tournaments.

This Figure already tells us a lot. First, I think that it clearly shows the power and accuracy my Monte Carlo simulations of the NCAA Tournament. The historical simulation results agree very closely with the actual number of upsets observed. Second, it provides a clear guide for knowing exactly how many upsets to expect.

Specifically, the first round usually has between six and 10 upsets per year. The second round typically has between three and seven. The Sweet 16 has one to three, and the regional final round usually has between zero and two. By the time we reach the Final Four, the higher seeds win most of the time, unsurprisingly.

As a subtle point to Figure 1, the 2021 NCAA Tournament may have slightly fewer upsets than expected in all rounds except the second round, which may be slightly above average.

Upsets Rates Based on Seed Combinations

While knowing the total number of upsets is useful, in order to start making our picks, it is necessary to understand the odds for upset in any given matchup. Figure 2 is my ultimate guide to understanding these odds.

20210316%2Bupsets%2Bby%2Bseed.jpg

Figure 2: Actual upset frequency for selected seed combinations relative to the odds predicted based on average spreads.

I mentioned above that the upset frequency is completely predictable based on the historical odds derived from the Vegas lines. This Figure demonstrates this fact. For example, everyone’s favorite upset pick is for the No. 12 seed to beat a No. 5 seed. This specific upset has occurred in all but five of the past 35 tournaments. History shows that roughly one-third of all No. 5 seeds lose in the first round.

Based on the Vegas spread, this makes complete sense. The average point spread for a No. 5/No. 12 matchup is right around five points, and teams favored by five points in college basketball win 69 percent of the time. The upset rate in the NCAA Tournament is exactly where it should be.

This logic extends perfectly even to the most rare and exciting of all upsets (at least when they happen to somebody else’s team). The upset of a No. 2 seed by a No. 15 seed has only happened eight times in history out of 140 games back to 1985 (when the NCAA Tournament expanded to 64 teams). That is an upset rate of a little over five percent. The average point spread in a No. 2/No. 15 game is around 16.5 points which corresponds to an upset rate of...five percent.

Even the most rare upset of all, No. 16 UMBC’s epic upset of No. 1 seed Virginia in 2018 was somewhat predictable. With only one occurrence in 140 games, the odds of this type of upset must be around one percent. This also happens to be exactly the odds predicted in games where the spread is about 24 points, which is the case in games between No. 1 and No. 16 seeds, historically.

Upset Rules of Thumb

Without any knowledge at all of the reason behind these upset rates, it is possible to develop a set of good rules of thumb in order to generate a bracket with a historically accurate number and distribution of upsets. Here are some rules that I like to use:
  • For the No. 8 versus No. 9 games, this is basically a toss-up. I usually consult the Vegas line for these games and then go with my gut on each one.
  • The odds of a first round upset of a No. 7, No. 6 or No. 5 seed are all similar at between 35 and 40 percent. This means that between four and five upsets total in this group are expected in any given year.
  • For the teams seeded No. 4 and above, the upset rate drops to 20 percent or less. That said, one or two “big” upsets a year is normal, usually with the No. 3 or No. 4 seeds.
  • For second round games, No. 1 seeds get upset prior to the Sweet 16 almost exactly once every-other year, on average. The rate has been a little higher than that recently. Exactly one No. 1 seed has been knocked out of the second round in seven of the last 10 tournaments. However, this came right after a stretch where all the No. 1 seeds advanced to the Sweet 16 in five straight tournaments.
  • Roughly one-third of all No. 2 seeds do not make it to the Sweet 16. Chances are, at least one will lose to a No. 7 or No. 10 seed in the second round. In 2019, all four No. 2 seeds advanced to the Sweet 16 for the first time since 2009.
  • As for the No. 3 and No. 4 seeds, basically only half of them survive the first weekend, on average.
  • In the Sweet 16 round, the upset rate for No. 1 seeds is about one-in-six and it is about one-in-five for No. 2 seeds. Basically, only two-thirds of all No. 1 seeds make to the regional final and a little under half of the No. 2 seeds usually make it.
  • As for the regional finals, the surviving No. 1 seeds get eliminated in a quarter of these games. Only 40 percent of all No. 1 seeds make it to a Final Four.
The Final Four and Champion

The rules of thumb above work well when applied to each individual region, but the crown jewel of every office pool bracket in the Final Four and eventual champion. Fortunately, there are several of pieces of historical data that can guide this decision making process as well.

For the teams that make up the Final Four, I find the figure below to be the most helpful.

20210316%2BFinal%2BFour.jpg

Figure 3: Distribution of seeds in the Final Four from 1979 to 2019

In this case I have grouped the seeds based on the highest seed, second highest seed, third highest, and lowest appearing in the Final Four. For example, 93 percent of the time (in all but three years: 1980, 2006, and 2011) at least one No. 1 seeds makes it to the Final Four.

However, the odds that the second high seed in the Final Four is also a No. 1 seed (i.e. at least two No. 1 seeds survive to the last weekend) only happens slightly more than half of the time (54 percent). Having three or more No. 1 seeds in the Final Four has only happened six times since the era of Magic Johnson.

As for the third highest seed, this distribution peaks at the No. 2 seed, but the No. 3 and No. 4 seeds also have fairly high odds. As for the lowest seed to appear in any given Final Four, that is most often a No. 3 seed, but almost all seeds down to a No. 11 seed have a reasonable probability. Only three times in history has there been a Final Four without a team seeded No. 3 or lower.

In other words, a typical Final Four consists of at least one No. 1 seed, another No. 1 seed or a No. 2 seed, another No. 2 seed or a No. 3 seed, and then some other lower seed.

In selecting the eventual National Champion, there is a very good rule of thumb based on Kenpom efficiency data. In 15 of the past 18 Tournaments, the eventual champion entered the NCAA Tournament ranked in the top six of Kenpom overall. In addition, 17 of the past 18 champions have ranked in the top 21 of offensive efficiency, and 16 have ranked in the top 31 of adjusted defensive efficiency. However, only three entered the tournament ranked No. 1 overall Kenpom.

For reference, the current top six teams in Kenpom are Gonzaga, Baylor, Michigan, Iowa, Illinois, and Houston. All six teams in in the top-10 in offense, but Baylor and especially Iowa are outside of the top-30 in defense. This leaves Gonzaga, Michigan, Illinois, and Houston as the most likely national title contenders in 2021.

The analysis above is great for putting together a bracket that looks like it is feasible based on historical trends. I have given you the blueprint to pick the correct distribution of upsets. But, the trick to winning the office pool is to pick the correct upsets, period. Just because we know that one or two No. 12 seeds are likely to update a No. 5 seed doesn’t help us if we don’t know which one to pick.

Fortunately, I have developed a method that might give you an edge. By carefully applying Kenpom efficiency data to any given bracket, it is possible to spot which upsets are more likely than others. It is possible to identify which region are more likely to proceed according to seed, and which regions are more likely to blow up. It is possible to predict which No. 1 seed is likely to get upset first and which dark horse team is likely to reach the Final Four instead.

In part two of this analysis, I will walk you through this analysis for the 2021 bracket. Stay tuned.

MEN'S BASKETBALL Dr. G&W Analysis: The Four Factors of Possible Opponents

March Madness is upon us at last

Last year, it was cruelly snatched away from us just days before Selection Sunday. College basketball fans have waited 24 months to taste the glory of this most wonderful month on the sports calendar. The waiting is finally over. The bracket has been released.

For Michigan State Spartan fans, the wait was unusually long and tense. Three entire regions were announced and the Spartans’ name had yet to be called. More concerning was that several obviously less deserving teams (*cough* Syracuse and Utah State *cough*) were already on the board, and it was clear that MSU had either slipped into the First Four... or off from the board entirely.

But, around 6:35 p.m. Eastern Time as the final section of the West region was revealed, MSU’s name was finally called. The Spartans have officially extended the now second longest active NCAA Tournament streak to 23 years. Based on where the Green and White were sitting just three weeks ago, just making the NCAA Tournament is a major accomplishment.

For the first time in program history, MSU will participate in the “First Four” play-in round. On Thursday evening, MSU will face UCLA at Mackey Arena on the campus of Purdue University. The winner will enter the full bracket as a No. 11 seed, where they will face No. 6 seed BYU at historic Hinkle Fieldhouse.

Based on the seed ranking list released by the NCAA, the Spartans were ranked as the top team that will play in the First Four. What this means is that had Oregon State not upset Colorado to earn the automatic bid in the Pac-12, the Spartans would have been an ordinary No. 11 seed.

In this case, UCLA would have faced Wichita State in the play-in round for the right to be a No. 11 seed, while Drake would have faced Louisville for the right to be a No. 12 seed. It is unclear exactly how the committee would have adjusted the bracket in this scenario, but as I look at it, I would guess that MSU’s first round opponent would have been No. 6 USC.

Nevertheless, the draw is what it is at this point. In a normal first weekend of the NCAA Tournament, the Spartans would have up to two games with three possible different opponents. This year, the Spartans might play in as many as three games (if all goes well) between Thursday evening and Monday evening against three of four possible opponents.

In order to get a feel for the strengths and weaknesses of these possible opponents, I decided to take a closer look at the statistical profile of each team that MSU could face using a similar approach to the one that I took last week with other MSU teams in history. Below, I will compare MSU to the other four teams on the horizon based on offensive and defensive efficiency and the “four factors” of efficient basketball: shooting, turnovers, rebounding, and free throw rate.

Sizing Up the Competition

Figure 1 below plots the Kenpom adjusted defensive efficiency of Michigan State and the four possible first weekend opponents versus the adjusted offensive efficiency. These are measures of the number of points each team will score or give up over 100 possessions, adjusted to the skill level of the opponent. A fairly simple equation can be used to convert the efficiencies of any given two teams into a projected point spread.

For MSU and the four possible opponents (UCLA, BYU, Texas, and Abilene Christian) are all shown by the labeled, large dots. In each label, I also include the national ranking of each team, based on Kenpom’s calculated offensive and defensive efficiencies. For reference, I have added the profiles are the remaining 13 Big Ten teams as smaller dots.

All subsequent figures will be labeled and set up in the same manner. For consistency, the axis may be in reverse order such that in all cases, the upper right-hand corner represents both good offensive and defensive stats, while the lower left hand corner is the opposite.

20210316%2BKP%2BEff.jpg

Figure 1: Comparison of the Kenpom adjusted offensive and defensive efficiencies for MSU, the four possible first weekend NCAA Tournament opponents, and the remainder of the Big Ten

As we can see, Michigan State and the four possible opponents form an inverted “L” shape on the efficiency graph. Basically Abilene Christian, MSU, BYU, and Texas all have very similar defensive profiles which rank between No. 26 (for BYU) to No. 36 (for Texas) in the country. For this metric, the outlier is UCLA, who ranks No. 86 overall on defense. If the Bruins were a member of the Big Ten, they would have the worst defense in the conference.

On the offensive side of court, it is BYU, Texas, and UCLA who have similar profiles. Those teams rank from No. 21 (Texas) to No. 28 (BYU) is scoring efficiency. MSU (ranked No. 98) has a significantly worse offense, but it is not as bad as Abilene Christian’s offense (No. 157).

Note that from an overall efficiency point of view, No. 6 seed BYU is actually better than No. 3 seed Texas. This suggests that if those two teams meet for a chance at a berth to the Sweet 16, the Cougars might be slight favorites over the Longhorns.

Relative to the more familiar Big Ten teams, BYU’s profile is pretty similar to both Purdue and Maryland. Texas is a bit more unique. For an efficiency standpoint, the Longhorns’ profile is a like a cross between Purdue and Penn State, or like Indiana, but with a better offense.

As for UCLA, the Bruins’ offense is similar in efficiency to Penn State and Purdue as well, but with a defense that is worse than Ohio State or Iowa. As for the Abilene Christian Wildcats, their overall efficiency is a cross between Nebraska and Northwestern. While that is not impressive, both of those teams logged high quality wins this year.

Shoot it!

Now, let’s dive into the four factors for each team in more detail, starting with shooting, as measured by effective field goal percentage.

20210316%2BeFG%2Bweekend%2Bpod.jpg

Figure 2: Comparison of the effective field goal percentages for MSU, the four possible first weekend NCAA Tournament opponents, and the remainder of the Big Ten

When it comes to pure shooting numbers, the best two teams in MSU’s first weekend pod are BYU and interestingly, Abilene Christian. BYU is better on offense (ranked No. 12) while Abilene Christian is better on defense (ranked No. 12 in the country on effective field goal percentage defense). Obviously, Abilene’s competition is not as good in the Southland Conference, but this is a notable statistic. Also note that BYU’s shooting profile is almost identical to Illinois in the Big Ten.

Texas is essentially the weaker combination of the previous two teams. The Longhorns apparently shoot like Abilene and defend shots like BYU. Michigan State plays good field goal defense, similar to some of the better Big Ten defensives, but on the offensive end, the Spartans, on average, have shot very poorly (ranked No. 266 in effective field goal percentage, nationally).

UCLA shoots reasonable well (No. 83 in the country, which is better than Purdue, but not as good as Maryland) but defensively, the Bruins are giving up over 50 percent from the field. Hopefully, this is just what MSU’s struggling offense needs.

In order to expand on the shooting statistics a bit more, I have also separated out the data for two-point and three-points shots on both offense and defense, as shown below in Figure 3.

20210316%2B2pt%2B3pt%2Bweekend%2Bpod.jpg

Figure 3: Comparison of the two-point (left panel) and three-point shooting numbers (right panel) for MSU, the four possible first weekend NCAA Tournament opponents, and the remainder of the Big Ten

This figure gives more detail about the relative strengths and weaknesses of each team from a shooting perspective. For two-point offense, Abilene Christian, Texas, and BYU have similar numbers. Texas’ two-point percentages are essentially identical to Iowa’s numbers. On defensive, however, BYU defends inside the arc better than Texas, who defends better than Abilene.

As we know, the Spartans’ have struggled shooting inside the arc and MSU’s two point defense, on average, is outside of the national top-100. As for UCLA, two-point defense is respectable, and the Bruins do shoot the ball a bit better than MSU.

From beyond the long line, the story is a little different. As for defending three-pointers, MSU, Texas, and BYU have similar numbers. On both sides of the ball and from everywhere on the court, BYU shoots and defends like Illinois (statistically). UCLA shoots the three almost as well as BYU. However, the Bruins are ranked only No. 242 in defending the three.

This is almost as bad as MSU’s three-point shooting (ranked No. 255). Without reviewing any film at all, I would say that MSU will likely have chances to knock down three-point shots against the Bruins on Thursday night. Can the Spartans hit them? That is the major question.

That all said, the most notable feature of Figure 3 is the three-point offense and defense of Abilene Christian. The Wildcats are in the top-25 nationally in both categories and lead all teams in MSU’s first weekend pod. A closer look at the Wildcats’ profile suggests that they don’t take a lot of threes (ranked only No. 197 in three-point attempts) but when they do, they are efficient. Interesting...

The Rest of the Four Factors

Let’s continue our review of the four factors with turnovers, as summarized in Figure 4.

20210316%2BTOs%2Bweekend%2Bpod.jpg

Figure 4: Comparison of the turnover rate for MSU, the four possible first weekend NCAA Tournament opponents, and the remainder of the Big Ten

For the four top rated teams in this pod, there is not a lot of difference in way that the teams take care of the ball or create turnovers. BYU and MSU’s profiles are similar in this regard. Both teams are OK at holding onto the ball, but neither team is good at creating turn-overs. Both Texas and UCLA create more turnovers than BYU and MSU, and UCLA is more careful with the ball, while Texas is more sloppy.

Only UCLA’s avoidance of turnovers ranks in the top-100 nationally in this category. There is no Bo Ryan era Wisconsin or John Beilein era Michigan squad in this pod when it comes to ball security.

But, once again the Abilene Christian Wildcats are the outlier. The Wildcats are a bit sloppy with the ball themselves, but they rank No. 1 in the nation in creating turnovers.

Let’s think about this for a moment. Abilene Christian is a small school in Texas who has a chance to play the University of Texas in the first round of the NCAA Tournament. Texas tends to turn the ball over, while Abilene is good at forcing turnovers. Also, the Wildcats happen to be a top three-point shooting team. Can you think of a better recipe for an upset? I am not sure that I can.

Moving on, Figure 5 below focuses on the rebounding prowess of each team in MSU’s pod.

20210316%2BOR%2Bweekend%2Bpod.jpg

Figure 5: Comparison of the turnover rate for MSU, the four possible first weekend NCAA Tournament opponents, and the remainder of the Big Ten

At first blush, all five teams in this first weekend pod seem to be respectable rebounding teams. The best two teams in this regard seem to be UCLA and BYU, especially on the defensive glass. The rebounding numbers are similar to Big Ten teams such as Michigan, Purdue, and Penn State.

MSU and Texas have similar numbers to each other as well. Texas is a little better on the offensive glass, while MSU is better on the defensive glass. If the two teams were to meet, this looks like a stalemate.

As for Abilene Christian, rebounding is a category where they struggle a bit. While the Wildcats have similar offensive rebounding rates as UCLA, Michigan State, and Texas, they are outside of the top-150 in cleaning the defensive glass. Abilene’s rebounding numbers most resemble those of Iowa.

Finally, Figure 6 below summarizes the ability of each team to draw or avoid fouls.

20210316%2BFT%2Bweekend%2Bpod.jpg

Figure 6: Comparison of the free throw rate for MSU, the four possible first weekend NCAA Tournament opponents, and the remainder of the Big Ten

For free throw rate, none of the five teams in this pod are particularly good in this area. BYU and UCLA grade out similar to some Big Ten members. UCLA is average in both categories, similar to Maryland and Purdue. BYU puts opponents on the line at a similar rate, but gets there themselves very infrequently, similar to Wisconsin.

The other three teams foul more frequently. MSU and Texas are similar in this regard, but Texas does a better job of getting to the foul line. Then, there is Abilene Christian. The Wildcats foul. They foul a lot. They currently rank No. 334 out of 347 teams that competed this year in opponents’ free throw attempts compared to field goal attempts.

Putting it all together

In MSU’s first game against UCLA, the graphs above start to paint a picture of what to expect. In some regards, the teams are mirror images. On average, MSU is a solid defensive team that struggles to score, while UCLA is a solid offensive team who struggles to defend. It will be strength on strength and weakness on weakness. In particular, the Bruins seem susceptible to three-point shooting, if MSU can hit those shots.

As for the other factors, on paper UCLA has a slight advantage in turnovers, rebounding, potentially at the free throw line. Overall, both teams have similar efficiencies. On balance, Kenpom and Vegas have both decided that UCLA is a slight, one-point favorite.

That said, MSU has shown that they can be a good offensive team at times, but has been inconsistent. Does UCLA have the ability to play good defense? Usually, that is harder to turn on. If MSU can play at close to the level that we saw against Indiana, Illinois, Ohio State, or Michigan (the second time) then MSU should win this game. However, if the Spartans play like they did against Maryland...it’s time to start thinking about spring football.

If MSU can beat UCLA, BYU looks to be a bigger challenge, as expected. On paper, BYU is similar in efficiency to a team like Purdue. The Cougars shoot like Illinois, but they don’t rebound it quite as well and they don’t get to the free throw line quite as often. Turnovers don’t look to be an important factor. Once again, if MSU plays close to the level of their potential, I see no reason why the Spartans cannot advance to the Round of 32.

If MSU is still playing on Monday, on paper, the Spartans would face Texas. Based on this analysis BYU grades out slightly better than Texas, and they have similar profiles. The Longhorns get to the free throw line a bit more often, but BYU seems a little better in most other areas.

That said, based on the analysis above and a broader analysis of the entire bracket (which is yet to come), I am going to go ahead and make this prediction now:

I am picking No. 14 Abilene Christian to beat No. 3 Texas, thus scoring the biggest upset of the first round. If MSU wins two games, I think that the Spartans draw the No. 14 seed with a berth to the Sweet 16 on the line.

If that were to happen, I do think that MSU would win. While a team that hits three-pointers and turns you over is scary, I think that the adrenalin dump of beating in-state foe Texas would result in a let-down in game two of the weekend for the Wildcats. That is what usually happens to double-digit seeded mid-majors in the second round. This year, it could be to MSU’s benefit.

Can MSU make it to the second weekend? I think that they can. Will they? That remains to be seen. Stay tuned, and Go Green.

TRANSFER PORTAL MSU Basketball active in portal

MSU Basketball has reportedly reached out to Northeastern PG Tyson Walker, Indiana G Al Durham, and PSU PF/C John Harrar.

It seems apparent MSU expects at least 1 Guard & 1 Forward/Center to not be with the team next season.

Walker is going to end up at a high-major of his liking, he put up big points & assists totals, while being the CAA Defensive Player of the Year. He’s 6’ & turns the ball over a bit too much, but he’s going to have 3 years of eligibility.

Durham is primarily an “ok” 3pt shooter, he can handle the ball decently, though he’s more a 2 than a 1. He’s 6’4, a good athlete, & can defend. I think he could be a fine 1 year rental combo guard.

Harrar is a bruising PF/C, an old school paint big at 6’9 240+lbs. He’s a strong rebounder and post defender. Harrar’s a little stiff, not a shot blocker, and isn’t going to play any stretch 4. That said, he finishes well at the basket & has steadily improved as a FT shooter, it’s a possibility he could achieve a 70% rate at the line. Grizzled grad transfer.

I expect many more players to be linked as basketball portal heats up. I’ve seen ppl speculate anywhere from 700 to perhaps 1,000 transfers (with the 1 yr COVID scholarship exception I believe there will be 5,000+ D1 CBB scholarships overall).

Login to view embedded media Login to view embedded media Login to view embedded media

MEN'S BASKETBALL Dr. G&W's Bracketology

Selection Sunday is finally here.

From a very young age, I have been obsessed with March Madness. The games themselves are full of drama, excitement, Cinderallas, buzzer beaters, celebrations, and heartbreaks. But, it is also the structure of the NCAA Tournament that has always intrigued me.

The bracket itself is a thing of beauty. It has an air of a mathematical work of art in the way that it reduces from 64 (or so) to 32 to 16 to eight and then finally to four, two, and then one. It is parade of powers of two, marching to a glorious conclusion.

For this reason, I have also long been obsessed with the concept of bracketology. First, it was in the hand-made paper brackets that I made as a child, and patiently filled out as each game game to its conclusion. Then it was the study of how the bracket is assembled, from the s-curve, to avoiding conferences rivals, to geographic optimization. Finally, it was the use of analytics to see if I could use math to dominate my office pool.

Last year, this was all cruelly taken away from us just nine days before the most holy day on the entire sports calendar. We have had to wait 24 long and difficult months. But, that magical day is here once again. It feels like a celebration. Just making it here almost feels like victory.

For the last several years, I have gone through my own exercise in bracketology. Yesterday and last night, as the results came in, I updated my seed like and rearranged my bracket. This morning, I wanted to show you what I came up with. In addition, I have a few notes on the biggest challenges in the construction of this year’s bracket as I see it. This will give us a few things to watch for as the real brackets are rolled out.

So, here are my four projected NCAA Tournament region brackets, arranged from No. 1 to No. 4 based on the rankings of the No. 1 seeds. In the Final Four, region No. 1 (the “West”) would face regions No. 4 (the “East”), while region No. 2 (the “Midwest”) would face region No. 3 (the “South”).

20210314%2BWest.jpg


20210314%2BMidwest.jpg


20210314%2BSouth.jpg


20210314%2BEast.jpg


Key Questions:

1) Who fell off from the bubble yesterday?

With upset wins by Georgetown and Oregon State in the Big East and Pac-12 Tournament finals, those two teams both earned bids, which will cost two other teams bids. In my estimate, it is Colorado State and Wichita State (who was also upset by Cincinnati) who will lose out in this transaction. ESPN basically agrees, while CBS favors Colorado State over Utah State and Wichita State over Drake.

Georgetown and Oregon State will now likely enter the tournament as No. 12 seeds, which means that the bottom two No. 11 seeds will now be filled by the winners of the two First Four games.

There is also one more bid stealer lurking on Sunday: the Cincinnati Bearcats. If they knock off Houston in the American Athletic Conference this afternoon, one more team drops out of the field. I agree with both CBS and ESPN that this would be the other Mountain West team, either Colorado State (if they are not already out) or Utah State.

2) Where will Michigan State be seeded?

I believe that the Michigan State Spartans are right on the cusp between a high No. 11 seed and a low No. 10 seed. I have MSU as the top No. 11 seed right now, and safely out of the First Four. ESPN and CBS agree, but the Spartans are dangerously close to the First Four... and the NIT.

While I still think that there is a 99 percent chance that MSU is in the NCAA Tournament field, with the upsets yesterday and the Spartans’ NET of 70, I cannot rule out the idea that Michigan State somehow gets left out. It is very unlikely...but it is still possible.

That said, I have MSU in the “Midwest” region with Illinois as the No. 1 seed. In my bracket, the Spartans would face No. 6 BYU in the first round with No. 3 Arkansas lurking. ESPN has MSU also as an No. 11 seed lined up to face No. 6 USC with No. 3 Texas in the same pod. CBS has the Spartans as a No. 10 seeds matched up with No. 7 Oregon with a possible matchup with No. 2 Alabama in the second round.

3) Who will be in the First Four?

In my bracket, the last four teams in are Drake, Louisville, Syracuse, and Utah State. If Cincinnati beats Houston this afternoon, I would slide Utah State off of the bubble and out of the tournament and UCLA would play in the First Four. ESPN basically is in agreement with me. CBS, though, has the First Four as Wichita State, Syracuse, UCLA, and Colorado State in the First Four, with the Rams as the team that would get cut.

4) How will the committee rank the No. 1 seeds?

With Michigan and Baylor losing early in the schools’ respective conference tournaments, the overall rankings of the No. 1 seeds is in question. As the only undefeated team, Gonzaga has to be the top ranked No. 1 seed, but the final placement of the other three teams is in question. This does matter as it relates to which teams would meet in the Final Four round were they to advance.

I would personally place Illinois as the No. 2 overall seed if the Fighting Illini can beat Ohio State today. If not, I would place Baylor in that spot. As for Michigan, the Wolverines’ loss to Ohio State on Saturday, and more importantly, the loss of Isaiah Livers drops them to the lowest of the No. 1 seeds in my estimation.

To me, this alignment also has some practical implications. It would keep Michigan and Illinois from potentially facing each other until the final game and it does the same thing for Baylor and Gonzaga, who were considered the two best teams for most of the year. To this point, this arrangement feels correct to me, and it looks like ESPN and CBS came to roughly the same conclusion.

5) Who is the last No. 2 seed?

Selecting the top seven teams is pretty easy this year, but the eighth overall team (the weakest No. 2 seed) is a bit tougher. ESPN has Houston in that slot, and CBS has Oklahoma State, even though the Cowboys lost to Texas in the Big 12 Final. I decided to award the Longhorns with that spot due to that victory, but I am not super confident in that pick.

6) Who is the last No. 4 seed?

Similar to the weakest No. 2 seed, selecting the lowest ranked No. 4 seed is tricky. CBS and ESPN agree on Purdue, Virginia, and Florida State, but they also have West Virginia in that spot. That looks a bit too high to me, and I have Villanova in that place instead.

7) How high will Georgia Tech rise?

Just a few days ago, the Yellow Jackets were on the bubble, but this morning they are your ACC Tournament champions. How high of a seed will they receive? Both ESPN and CBS have Georgia Tech as a No. 9 seed. I have them a bit higher at No. 8. But, as we have discussed with Michigan State, the prospect of facing a No. 1 seed in the second round is no reward.

8) Where will the committee place BYU, Loyola-Chicago, San Diego State, Saint Bonaventure, and VCU?

In a normal year, comparing the resumes of mid-majors to high major teams is tricky and in 2021, this job is even harder. I am really curious where BYU, San Diego State, Loyola-Chicago, Saint Bonaventure, and VCU will get seeded.

I personally have BYU as a No. 6 seed, which is where ESPN has them, but CBS has the Cougars as only a No. 8 seed. I have Loyola as a No. 7 seed, but that is higher than either ESPN (No. 8) or CBS’ placement (No. 10). As for the Aztecs, I also have them as a No. 7 seed, but ESPN has them higher as a No. 6. CBS, however, has them on the nine-line.

VCU and the Bonnies still need to decide the Atlantic 10 Title this afternoon, which makes things even harder. ESPN just placed them both as No. 10 seeds and called it a day. I agree on VCU, but I have Saint Bonaventure as a No. 9 (assuming that the Bonnies win today). CBS have the two team both at one seed lower than where I have them.

9) What other teams are hard to seed?

There are a few other teams that I had trouble seeding. Clemson scores really high (No. 15) in my NEW results-based metric, but the Tigers are in the 40s in Kenpom and the NET. As a compromise, I placed them as a No. 7 seed. CBS has Clemson as a No. 6 seed, while in ESPN, they are a No. 10 seed.

Texas Tech has a strong NET (No. 17) and Kenpom ranking (No. 24), but the Red Raiders score poorly in the NEW Index (No. 45) and as a result, I dropped them to a No. 7 seed. CBS agrees with this placement, but ESPN has Texas Tech as a No. 5 seed.

Oklahoma also scores poorly in the NEW Index (No. 48) but unlike Texas Tech, the Sooners’ NET (No. 37) and Kenpom ranking (No. 38) are also fairly weak. I still placed the Sooners as a No. 8 seed, which is in agreement with ESPN and CBS, but I wonder if this placement is too high.

Similarly, Virginia Tech’s metrics are not impressive to me. The Hokies rank No. 50 in Kenpom, No. 48 in the NET, and No. 42 in the NEW Index. CBS places them on the seven-line, while ESPN has them as a No. 9 seed. To me, the Hokies’ metrics simply do not support that. I have Virginia Tech as a No. 10 seed.

10) How good of a job will the Committee do in avoiding conference rematches?

Perhaps the biggest criticism that I have had for the Selection Committee over the past few years is in the way that they have allowed conference teams to face each other in the early rounds of the NCAA Tournament. For example, in 2019, Michigan State played Minnesota in the second round and came very close to having the play Maryland, in Washington D.C. in the Sweet 16.

The argument (i.e. excuse) has been that the Committee wants to prioritize reducing travel time for teams and fans, and sending MSU to Washington D.C. to face a Big Ten team is better than sending them to Spokane or Los Angeles. While there is some truth to that in most years, the tournament will be held exclusively in Indiana this year. So, there is no excuse for lazy bracketing (which is what this is in reality).

With nine total Big Ten teams almost certain to make the Big Dance, it is mathematically impossible to completely prevent any conference foes from meeting prior to the Sweet 16 in at least one case. But, as I show above, it is not that difficult to avoid this type of rematch.

I placed No. 2 Iowa, No. 5 Wisconsin, and No. 9 Rutgers in the West. Wisconsin and Rutgers could, in theory, meet in the Sweet 16, but both teams would need to score upsets to get there. In addition, those teams did only play once in the regular season. Those two teams cannot meet Iowa until the regional final, and that is very unlikely.

The other three regions in my bracket each contain only two Big Ten teams and in none of the three cases can the Big Ten foes meet prior to the regional final. In the Midwest, I have No. 1 Illinois and No. 11 Michigan State. In the South, I have No. 2 Ohio State and No. 4 Purdue. In the East, I have No. 1 Michigan and No. 10 Maryland.

See, committee members? It’s not that hard.

That is all for now. Enjoy Selection Sunday, everyone and Go Green.

MEN'S BASKETBALL Dr. G&W Analysis: Life on the Bubble

Over the past two weeks, the Michigan State Spartans navigated one of the most intense gauntlets of conference play that I can ever remember. Over the span of 16 days, the Spartans played seven games, three of which were on the road and four of which were against top-five ranked opponents. The Green and White went 5-2 over that span, and in the process seem to have secured an NCAA Tournament bid.

I was eager to see what Michigan State was going to look like after a few days of rest, and after surviving the previous two weeks. For 10 minutes, MSU looked great, but unfortunately, a college basketball game is 40 minutes long, and the Spartans stay in the 2021 Big Ten Tournament lasted just a day.

This has very much been a Jekyll and Hyde type of season for the Spartans. Like every other fan, I was hoping that this phase was behind us. I was hoping that Dr. Jekyll was here to stay, but on Thursday, we mostly saw Mr. Hyde.

That said, the loss to Maryland may not be all that bad. Had MSU won the game, there was a strong possibility that the Spartans would have climbed up to the No. 9 or No. 8 seed line, which is not ideal. Furthermore, as it stands now, the Spartans will retain bragging rights of having defeated the Wolverines in the last meeting of the schools, which is nice. Finally, the Spartans likely could use the additional rest and practice time anyway.

More than anything, the loss has shaken some of the confidence of what this Spartan team can accomplish in March. Michigan State has shown clearly that it is capable of beating some of the best teams in the country. There is no doubt in my mind that the Dr. Jekyll version of the Spartans can be a nightmare for any team in this tournament. This team is capable of making it to the Final Four. Seriously.

On the other hand, the Mr. Hyde version of this team is capable of getting blown out in a First Four match-up by 30 points or more. Based on the overall efficiency of this team to date, an early exit (first or second round) from the NCAA Tournament seems most likely. While I remain optimistic, the last 30 minutes of the Maryland game were concerning.

But, before we talk too much more about a NCAA Tournament run, Michigan State first needs to simply secure a bid. The early exit from the Big Ten Tournament places MSU a bit closer to the bubble than perhaps we would all like. In less than 48 hours, the first NCAA Tournament bracket in the last 24 months will finally be released. It seems extremely likely that MSU will be on it. But... how sure are we?

A Last Look at the Bubble

Based on the consensus of online bracketologists, MSU still looks to be quite safe. The distribution of seeds that the experts have projected for MSU is shown below below in Figure 1, based on the current data collect by the bracket matrix website.

202103012%2BMSU%2Bseeds.jpg

Figure 1: Distribution of seeds for MSU based 133 public brackets on the bracket matrix website

As we can see, the consensus is clearly that MSU will draw a No. 11 seed, with a No. 10 or No 12 seed in play as of Saturday morning, ESPN and Fox have the Spartans as a No. 11 seed, CBS has MSU as a No. 10 seed. With MSU in the clubhouse until Sunday evening, is this likely to change? Let’s take a look at the updated resumes of the rest of the teams currently on or near the bubble.

In this case, I have included a column listing the current projected seed from both ESPN and CBS, where “L4” stands for “last four” either in (with the seeds noted) or out. I have sorted this list based on ESPN’s seed list. The rows that are shaded indicate that teams is no longer playing and has no more chances to improve or damage their resume.

Table 2: Resumes of selected bubble teams
20210313%2BBubble%2Btable.png


If ESPN is correct, the Spartans are two spots away from the First Four and six spots away from missing the tournament entirely. If CBS is correct, the cushion is larger. CBS has MSU at least five slots away from the First Four and nine slots away from oblivion. I am personally in-between. I have MSU as a high No. 11 seed, above UCLA and VCU, but below Wichita State.

While this may seem like it is too close for comfort, I am still quite confident that MSU will hold at this position. As the table shows, most of the other teams are out of their respective conference tournaments and at least to my eye (and the eyes of most bracketologists) the Spartans’ resume on balance is quite a bit better than most other teams on the bubble. That is not going to change by Sunday night.

While the Spartans’ NET ranking (70), Kempon ranking (55) and overall record is not pretty, MSU has five quad-one wins and now only one non-quad-one loss. No other bubble team is even close in this category. Furthermore, MSU’s ranking using my just created NEW Index is a comfortable No. 35. While this is meaningless to the committee, I believe that it correlates better to the opinions of various experts and therefore might correlate to the thinking of the actual committee members as well.

Threats From Below

While I am confident that the Spartans will wind up with a No. 10 or No. 11 seed, there are a few cases to consider as unlikely, but bad scenarios. Let us first start with the assumption that the less optimistic placement by ESPN is correct. This would assume that MSU is below UCLA and the eventual loser of the Atlantic 10 Championship game. Both CBS and I have MSU ahead of both teams, but we cannot rule the idea out that Joe Lunardi is correct and Jerry Palm is wrong.

If this is true, then what other teams have the potential to be ahead of MSU on the seed line in the eyes of the committee? Here is a list in descending order of threat potential:

1) Wichita State

The Shockers are ahead of Michigan State both based on the CBS bracket and in my NEW Index, so I think that it is certainly possible that they might wind up seeded above MSU in the final bracket, especially if they make it to the AAC Championship Game. If the Shockers win the AAC title, they cannot play in First Four play-in round, which also might impact MSU’s placement.

2) Drake

The Missouri Valley Conference runner-up has a very nice record (23-4) and respectable NET (44), but the Bulldogs only have one impressive win on the year over Loyola Chicago to go along with two loses outside of the NET top 150. They are just two spots below MSU in my NEW Index. If the committee has a soft spot for scrappy mid-majors, Drake could wind up above Michigan State.

3) Utah State

The likely Mountain West runner-up has a similar resume to Drake. The overall record is not as good, but the Aggies have a better NET. The quality wins look a little better than Drake (although Utah State has one more bad loss). I could at least imagine the committee being impressed by that, but it is a stretch. If the Aggies beat San Diego State and win the Mountain West, similar to Wichita State, they would not be eligible to play in the First Four.

4) Louisville and/or Syracuse

Either of these teams ending up ahead of Michigan State on the seed line would be a major joke, in my opinion. Louisville’s NET ranking is not that much better than MSU’s NET ranking, and the Cardinal’s best win (at Duke) is also MSU’s fourth best win. On the other hand, while Syracuse has a much better NET ranking (40), its best win is technically at North Carolina State, which is just barely quad-one. I just don’t see it.

Even if the committee somehow put all five of those teams above MSU (which seems extremely unlikely) the Spartans would still wind up in the First Four. While I suppose that it is theoretically possible that the committee could somehow elevate some other team on this list (such as Saint Louis or Colorado State) this is really stretching the boundaries of what is reasonable.

Bid Stealers

While there is some threat from other teams on the bubble, the bigger threat to Michigan State’s position right now is coming from a rapidly shrinking pool of teams that have little or no chance to make the NCAA Tournament as an at-large team, but who could still make the Big Dance by winning their conference tournaments. These teams would each knock the lowest seeded at-large team off from the bubble and steal a bid. In other words, these teams are potential “bid stealers.”

These teams would almost certainly wind up seeded below MSU on the seed line, but they would also push the bubble upward. In effect, this increases the odds that MSU will need to play in the First Four play-in round (as automatic bids outside of the No. 16 seeds cannot play in the First Four).

For most of the remaining conference tournaments, there are no potential bid stealers out there. In the ACC, Big 12, Big Ten, and the SEC, all remaining teams are already safely in the tournament field. However, that is not the case in the Big East or the Pac-12. In addition, the American Athletic Conference still has a few wild cards remaining. All of the other conferences do not pose any risk.

The currently remaining bid stealers are:

1) Georgetown (Big East)

The Hoyas upset Villanova and then Seton Hall to earn a spot in the Big East Championship game on Saturday. If Georgetown beats Creighton (24 percent odds, according to Kenpom) to claim the title, one bubble team is headed for the NIT.

2) Oregon State (Pac 12)

The Beavers upset UCLA and then rival Oregon on the way to the Pac-12 Championship. Oregon State now will face Colorado (23 percent odds of an update) with a chance to earn a bid while simultaneously ruining the day of another bubble team.

3) Memphis or Cincinnati (AAC)

Neither the Tigers nor the Bearcats project to be in the NCAA Tournament right now, but one of them would be if they were to win their next two games. I project about a 13 percent chance that Memphis wins the AAC and only a 2.4 percent chance that Cincinnati claims the title. The question here is if Wichita State would stay in the field or not. It is possible that the committee could simply replace one AAC team with another. But, it is possible that the league would get three teams, thus shrinking the bubble.

Right now, there is about a 50 percent chance that at least one of those teams pulls the upset.

The Bottom Line

As I see the bubble right now, I think that most likely MSU will remain as a No. 11 seed (if not a No. 10 seed) and not in the First Four. But, there are a few scenarios where the Spartans could find themselves in the play-in round. First of all, ESPN’s current projection would need to be close to correct or even optimistic.

Then, a few upsets this weekend, such as Utah State winning the Mountain West and Oregon State winning the Pac-12 would need to knock a few teams off the bottom of the bubble and slide the First Four line up to meet MSU.

Is there a disaster scenario out there where the Spartans miss the Big Dance entirely? Yes, but it is an extreme long shot. For this to happen, I believe that two or three of the bid stealers above would need to win their respective tournaments and some combination of at least five or six of the following teams would need to wind up above MSU on the seed line:
  • VCU
  • UCLA
  • Syracuse
  • Louisville
  • Drake
  • Utah State
  • Saint Louis
  • Colorado State
This seems extremely unlikely. While I imagine that there will be some sweaty palms in my house until I actually see the Spartans’ name on the bracket, I am confident that MSU will still be dancing. How long will they stay? That all depends of which version of MSU emerges over the next week of practice.

HOCKEY Izzo

Doesnt treat all the kids remotely the same.
The leash given some, and not others is zany.
Beat me up all you like, but Izzo is a step slow, its probably him refusing to have some of these assistants move on... to somewhere. Stale.
But the lack of coaching and the deference shown some, not others is very unusual. How can kids actually be OK with that.
Think having an All- American coach on the floor actually masked some of these issues last couple years
  • Like
Reactions: CaliSpartan

MEN'S BASKETBALL Dr. G&W Analysis: Scouting Seeds and Possible Opponents

Just a few days ago, it seemed likely that much of the focus this week was going to center on if the Michigan State Spartans were going to make the NCAA Tournament and if so, could they avoid the First Four pair of games reserved for the “last four teams in.”

But, MSU went out and beat the No. 2 ranked Michigan Wolverines on the last day of the regular season to all but clinch a ticket to Big Dance. Basically all prognosticators agree that even if the Spartans drop their first Big Ten Tournament game to the Maryland Terrapins, the Spartans will see their names in the bracket on Sunday night.

However, what seed is MSU likely to receive? Who are some likely opponents? What is the best and worst case scenarios? I would like to explore these questions today. But before we do that, let’s get an update on the “newly” created results-based metric, the NEW Index.

NEW Update

This weekend, I introduced my “performance relative to Normalized Expected Wins” metric, as a simple, transparent, and more accurate replacement for the NCAA NET metric. Briefly, the NEW Index measures the number of expected wins (based on spreads derived from Kenpom efficiency data) that an average power five team should receive if that average team were to play any given team’s schedule. It then compares the actual number of wins for the team in question to that expectation. This results is then divided by the total number of games played to get a marginal win percentage.

My initial analysis of the current expert NCAA Tournament projections suggests that the NEW Index is more accurate than the NET in selecting and seeding teams. It will be interesting to see how it does in the days leading up to Selection Sunday. For now, here is a brief update on the current NCAA Tournament resumes for the top-10 Big Ten teams, including the updated NEW rankings.

Table 1: Updated Big Ten Tournament resumes, including the NEW Index rankings
20210310%2BNEW%2BUpdate.jpg


The projected seeds are based on the current information on the bracket matrix website and the “NEW Seeds” are based simply on a direct application of the rankings to the s-curve seed list. In other words, the top four teams in the NEW Index get No. 1 seeds, the teams ranked No. 5 to No. 8 get No. 2 seeds, etc.

The NEW Index is in complete agreement with the experts on the seeds for Illinois and Michigan (No. 1 seeds) as well as for Iowa and Ohio State (No. 2 seeds). Interestingly, the NEW Index is currently very high on Purdue and has the Boilermakers also as a No. 2 seed while most bracketologists have them as a No. 4 seed. While I have a hard time believing that the Big Ten would get five out of the top eight seeds, I think that a No. 3 seed is in play for Purdue if the Boilermakers can make the Big Ten semifinals.

As for the rest of the conference, there is some disagreement between the NEW Index and the current seed projections. The NEW Index is more favorable for Wisconsin (No. 6 instead of a No. 7 seed) and Rutgers (No. 7 instead of a No. 9 seed), but it is less favorable for Maryland (No. 12 seed instead of a No. 10 seed).

As for Michigan State, following the Spartans’ win over the Wolverines, MSU shot up to No. 24 in the NEW Index, which would be good enough for a No. 6 seed. This is certainly quite a difference and I would tend to believe the experts current projection of a No. 11 seed is much more accurate. However, it would not shock me if the committee winds up placing the Spartans a little higher on the seed list than folks like Joe Lunardi will be projecting on Selection Sunday.

What If...

The formula to calculate Michigan State’s (or any other team’s) NEW ranking is so simple that it is possible to estimate the future ranking of each team based on future outcomes. For example, what happens if MSU were to lose to Maryland or what would happens if MSU were to win the Big Ten Tournament? I can perform these simple calculations and see where the Spartans might wind up. Those are summarized here:
  • If MSU loses to Maryland => NEW ranking drops to No. 36 (No. 9 seed)
  • If MSU beats Maryland, and losses to Michigan => ranking improves to No. 22 (No. 6 seed)
  • If MSU beats Maryland and Michigan, but loses in the semifinals to Ohio State => ranking improved to No. 17 (No. 5 seed)
  • If MSU beats Maryland, Michigan, and Ohio State, but loses in the finals to Illinois => ranking improves to No. 11 (No. 3 seed)
  • If MSU wins the Big Ten Tournament with wins over Maryland, Michigan, Ohio State, and Illinois => ranking improves to No. 8 (No. 2 seed)
First, I know that this sounds ridiculous. There is no way that MSU could go from a team barely on the bubble to a No. 2 seed over the span of a week...right? But, think about the resume the Spartans would assemble in this process. MSU would finish the Big Trn Tournament with nine quad-one wins and would have gone 6-1 combined against teams currently ranked in the top six of the seed list in the last 10 games of the season.

What would the committee do with MSU in that situation? Only 11 teams total had nine or more quad one wins prior to the tournament in 2019 on a full schedule. Besides, if MSU did somehow accomplish this feat, they would very clearly be the hottest team in the country. NO ONE would want to face the Spartans. How low of a seed could the committee actually give them without disadvantaging other teams in the field?

So, what is MSU’s ceiling? We have no actual way of knowing what the committee would think of such a run, but I think that a No. 4 or No. 5 seed would be a strong possibility with a Big Ten Tournament Title. But, as I have calculated, the odds of MSU winning four games in four days to claim the title are quite low (one to 15 percent at the absolute best).

As for the other scenarios, it is impossible to predict what the committee will actually do, but I have the following guesses, assuming no major upsets that would lower the value of each win:
  • MSU loses to Maryland => No. 11 or No. 12 seed
  • MSU beats Maryland, but loses to Michigan => No. 9 seed or No. 10 seed
  • MSU beats Maryland and Michigan => No. 7 seed or No. 8 seed
  • MSU loses in Finals = No. 6 or No. 7 seed
  • MSU wins the Tournament => No. 4 or No. 5 seed
That is a crazy amount of variation, but I think that it is fairly reasonable.

Possible Opponents

With this uncertainly, there is a wide range of possible opponents that Michigan State could face in the first few rounds of the NCAA Tournament. That said, it is possible to take a quick look at the field to get an understanding of what the bracket might look like.

One visual tool that I find useful is to compare the efficiency of each team to the historical Kenpom efficiencies of teams with the same seed. That comparison is shown below in Figures 1 and 2 based on the seeds for each team as listed by the bracket matrix.

20210310%2BKP%2BHigh%2BSeeds.jpg

Figure 1: Comparison of current teams to the historical efficiencies of teams with their projected seed for seeds No. 1 to No. 8

20210310%2BKP%2BLow%2BSeeds.jpg

Figure 2: Comparison of current teams to the historical efficiencies of teams with their projected seed for seeds No. 9 to No. 16

In these plots the historical average and standard deviation for the Kenpom adjusted efficiency margin of each seed, from No. 1 to No. 16 is shown with the blue dots with the error bars. I have also added the efficiency for each team projected to be in the 2021 field in the position of their current projected seed. This allows us to quickly see if a team is strong or weak relative to past teams with the same seed.

For example, if we look at the No. 1 and No. 2 seeds, we see that the teams in line to receive these seeds are almost all above average or well above average. The only team that sticks out as being simply average is Alabama. The Crimson Tide currently project as the weakest of the No. 2 seeds.

With this introduction, let’s look at a few possible scenarios for MSU in more detail.

MSU draws a No. 12 seed

I wanted to first say that I personally think that it is pretty unlikely for Michigan State to wind up as a No. 12 seed. Based on the current distribution of seeds, in order to wind up as a No. 12 seed, the Spartans would likely need to drop back down into the “last team in” category, and I just don’t think that would happen, even if MSU losses badly to Maryland, which I do not expect.

That said, if this were to happen, MSU would likely face one of the other bubble teams in the First Four:

Possible first opponents: Drake, Boise State, Colorado State, Xavier, Louisville, Georgia Tech, VCU, and others.

As Figure 2 shows, all of these teams have pretty similar efficiencies that are all slightly above average for No. 11 or No. 12 seeds. MSU should beat all of these teams easily, as long as the Spartans play at a level similar to what we have seen over the past few weeks. The only exception might be Georgia Tech, who looks to be a little tougher, but who I also do not expect to be in the First Four.

Possible first and second round opponents (No. 5 and No. 4 seeds): Colorado, Creighton, Florida State, Texas Tech, Purdue, Virginia, Villanova, and Oklahoma State

As Figure 1 shows, almost all of these teams also seem to be above average relative to historical efficiencies. The lone exception is Oklahoma State. So, if the Spartans were to find themselves in this part of the bracket, Kenpom data suggests that the Cowboys would be the easiest opponent in this group.

MSU draws a No. 11 seed

If Michigan State loses to Maryland, this might be the most likely scenario, and honestly it might be the one that puts the Spartans in the best possible position to make a March run.

Possible first round opponents (No. 6 seeds): USC, Tennessee, Oregon, and Oklahoma

While all four of these teams would likely be favored over MSU, none of these teams particularly scare me. USC and Tennessee have the stats of above average No. 6 seeds, but Oregon and Oklahoma both look potentially ripe for an upset.

Possible second round opponents (No. 3 seeds): Arkansas, Texas, Kansas, and West Virginia

One other thing that sticks out about Figures 1 and 2 is that most teams in 2021 are projecting to be above average. Personally, I doubt that this is true in reality. I think that this may be a symptom of the condensed schedules and storage of inter-conference games.

That said, to the extent that we can trust any of this data, Figure 1 does imply that as a group the No. 3 seeds are a bit weak. Of those four teams, Arkansas looks slightly better, but honestly I would be very happy with any of those teams as possible second round opponents. Furthermore, I think that we would see a lot of prognosticators on Sunday night putting MSU into the Sweet 16 with this draw.

MSU draws a No. 10 seed

If MSU wins only one game in the Big Ten Tournament, a No. 10 seed seems likely, in my opinion.

Possible first round opponents (No. 7 seeds): Wisconsin, Clemson, BYU, and San Diego State

The bracketing principles released by the NCAA clearly says that MSU cannot face a Big Ten opponent such as Wisconsin in the first round, so the Badgers are off the table. Based on Kenpom data BYU and San Diego State are relatively strong, but Clemson is a possible weak link. They would be an opponent to look for if MSU were to wind up on this line.

Possible second round opponents (No. 2 seeds): Alabama, Iowa, Ohio St., and Houston

Here is another situation where the bracketing rules may come into play. Michigan State played both Iowa and Ohio State twice in the regular season. As a result, MSU cannot face those teams until the Sweet 16. Therefore, if MSU does draw a No. 10 seed (or a No. 7 seed) and if this seed list holds, the Spartans would be lined up to potentially face either Alabama or Houston in the second round.

Based on the efficiency data, facing Alabama projects to be an easier draw than Houston. That said, Houston played a very weak schedule this year and I have my doubts that the Cougars are actually as good as their efficiency numbers imply. I would be okay to face either team in the second round, if that situation were to come to pass.

MSU draws a No. 8 or No. 9 seed

If Michigan State does beat Maryland, it is certainly possible that the Spartans would get getting bumped up to the No. 9 or No. 8 line in the tournament. This in not ideal, as the Spartans would almost certainly draw a No. 1 seed in the second round were they to advance. While MSU has already gone 2-1 against other projected No. 1 seeds in the last two weeks, I would prefer not to face another one this soon.

Possible first round opponents (other No. 8 or No. 9 seeds): LSU, Missouri, Florida, Loyola Chicago, UCONN, Connecticut, St. Bonaventure, North Carolina and Virginia Tech

Maryland and Rutgers are also floating around near this part of the bracket, but once again it would violate bracketing principles to face a Big Ten team in the first round. Of these possible opponents, many of them appear to be above average, but Missouri and Virginia Tech stick out as the weakest of this bunch, based on Figure 1 and 2 above.

Possible second round opponents (No. 1 seeds): Gonzaga, Baylor, Michigan, and Illinois

Interestingly, the bracketing principles prevent MSU from being placed in Michigan’s region as a No. 8 or No. 9 seed (as they played twice already), but there is the possibility that MSU could be placed in the same region as Illinois, since those teams only faced off once. Based on the tremendous flexibility that the committee has this year with no consideration for geography, this would gross incompetence and malpractice on the part of the committee... but I cannot rule that out entirely.

That said, if MSU is to draw a No. 8 or No. 9 seed, it is basically a coin flip between being placed in a bracket with Baylor or Gonzaga. Which option is better? Baylor? Maybe? That would be my choice, but this would be a very disappointing draw.

MSU draws a No. 7 (or higher)

If MSU beats Maryland and then beats Michigan again, I think that it is possible that MSU will pull themselves out of the No. 8/No. 9 line and up to the No. 7 line. I am not sure of this, but this is what I am thinking. This would once again put MSU in a position to possible make a little noise in March.

Possible first round opponents (No. 10 seeds): UCLA, Maryland, and Rutgers

In this analysis, MSU is a No. 10 seed as well so there are only three other teams in this group, and two of them MSU cannot play in the first round. Obviously at least one other team, such as Virginia Tech would have to fall to the No. 10 line if MSU were to move up. Neither UCLA or the Hokies scare me, particularly.

As a No. 7 seed, Michigan State would line up to face a No. 2 seed in the second round so the analysis above holds true. If MSU rises to a No. 6 seed, the Spartans would face a No. 11 seed, which in general are the teams listed above as on the bubble and potential First Four teams. If MSU were to somehow make it up to the No. 5 or even No. 4 line, the Spartans would likely face another No. 4 or No. 5 team in the second record.

In Summary...

To put a bow on this, there are a lot of good scenarios for Michigan State and a few bad ones. The best draw, to me, would be if MSU were to either wind up as a No. 6 or a No. 11 seed. Either way, the Spartans would not have to play any team seeded better than No. 3 in the first weekend and the projected No. 3 seeds right now all look relatively weak.

Furthermore, I seriously doubt that the committee would place Michigan State in the same Region as Iowa or Ohio State if they could avoid it (and they should be able to... it’s not that hard). This means that even the No. 2 seed in that Region would not be that scary. I am not saying that MSU would even win the first game in this scenario, but I do think that it provides the best odds for success.

If MSU were to draw a No. 7 or No. 10 seed, it would almost be as good. This would ensure that the Spartans are not paired with Iowa or Ohio State and the other No. 2 seeds might be ripe for an upset.

The worst case scenario is for MSU to wind up as a No. 8 or No. 9 seed. Unfortunately, I think that the odds are 50-50 that this is where the Spartans wind up, especially with a win over Maryland.

In just a few days, all of the speculation will be over and we will have our first official NCAA Tournament bracket in 24 months. Just hearing the intro music to the Selection Show is bound to bring a tear to my eye. Once the bracket is set, it will be time to break it all down.

Stay tuned and Go Green.

MEN'S BASKETBALL Dr. G&W Analysis: The Four Factors and MSU in 2021

Michigan State fans had a great weekend. Not only did the Spartans beat a highly-ranked Michigan Wolverines squad, but in doing so, Michigan State almost certainly secured a bid to the program’s 23rd consecutive NCAA Tournament. Barring a miracle run by the Duke Blue Devils in the ACC Tournament, in two year MSU might just own the second longest streak in history, second only to Kansas’ current record of 30 (and counting).

That said, the Spartans did still finish below .500 in conference play. By that measure, this is officially Tom Izzo’s worst team on record. But, as the old saying goes, happiness is the difference between expectation and reality. Our collective spirits were so low at the beginning of February that the run over the past few weeks was as exciting and satisfying as any run to the Final Four, and likely more challenging.

What can I say? These are certainly strange times that we are living in.

But the fact remains that at least for the regular season, based on win and losses, this MSU team struggled. In order to try to understand how and why those numbers are not better, I wanted to take a deep dive into the numbers, starting with Kenpom efficiency data.

The Kenpom Scatter Plot

Throughout the Big Ten regular season, I have been generating a scatter plot which compares various teams based on their adjusted offensive and defensive efficiency. These efficiencies are a measure of the number of points a team scores and allows per 100 possessions, averaged over the entire season.

Figure 1 below shows this scatter plot as it stands at the end of the regular season, and it contains several different sets of teams for comparison. The green line shows the trajectory of MSU’s season over time, with MSU’s current position shown by the larger, labeled green dot. The slightly smaller green dots represent the stats of previous Tom Izzo teams.

20210309%2BKP%2BScatter.jpg

Figure 1: Kenpom adjusted efficiency scatter plot as of March 9

The small blue unlabeled diamonds are previous NCAA champions, dating back to 2002. These teams collectively define the boundaries of the blue shaded “championship zone.” Included within that zone are the 22 current teams whose profiles are consistent with past champions, including Gonzaga, Baylor, Michigan, Illinois, Houston, Iowa, Wisconsin and Purdue.

The Spartans are currently well outside of the championship zone. Other notable teams that also reside outside of this zone include Ohio State, San Diego State, Kansas, Tennessee, and West Virginia.

At the beginning of the year, Kenpom estimated that MSU would be a fairly strong defensive team, with some offensive deficiencies. The starting point for the Spartans was with a profile similar to Coach Izzo’s 2003 team that made the Regional Final and the 2013 team that made the Sweet 16.

However, once the season started, the Spartans’ defensive efficiency began to fall. Then, starting right around the beginning of the year, it was MSU’s offense then suddenly started to degrade. For much of February, the Spartans’ profile most closely resembled Coach Izzo’s 1997 team that failed to make the NCAA Tournament at all.

But, over the last few games, MSU’s efficiency has improved a little, such that the Spartans are now resting close to the diagonal that represents an efficiency margin of +15.00, which is similar to the MSU teams from 2002, 2017, and 2011. Those teams all made the NCAA Tournament, but only the 2017 team won a game. The 2021 Spartans are better defensively than those three teams, but not as good offensively.

The Four Factors

In order to better understand the relative strengths and weaknesses of the 2021 team, it is helpful to dig deeper into several key basketball statistics. In general, there are four key factors that people who study basketball analytics say have the biggest impact on efficiency. These are typically referred to as “the four factors,” which include field goal percentage, rebounding, turnovers, and free throw rate.

Let’s take a look at how the 2021 Michigan State team compares to past MSU teams using each of there four factors in reverse order of importance, starting with free throw rate. Figure 2 make the first of these comparisons.

20210309%2BFT.jpg

Figure 2: Comparison of free throw rate for the 2021 MSU team to other Tom Izzo coached teams

Each four factors graph will be formatted the same way. MSU’s offensive performance is plotted on the x-axis and MSU’s defensive performance will be plotted on the y-axis. The stats for the 2021 team are shown by a larger purple dot, while previous teams are marked with smaller, green dots. The numbers on the axis will either go in ascending or descending order such that a data point towards the upper right hand corner is good, while a data point in the left hand corner is bad.

The first of the four factors is free throw rate, which is traditionally defined as the number of made free throws per field goal attempt. Basically, on offense this measures how often a team gets to free line (and converts) and on defense it measures how often a team fouls.

Right off the bat, we have found an area where the 2021 team has struggled. The 2021 team, relatively speaking, does not get to the line very much, and they tend to foul a lot. That is a bad combination.

However, free throw rate is known to be the least important of the four factors, and as the figure shows, several of Coach Izzo’s best teams have also struggled in this area. Both the 1999 and 2015 Final Four teams fouled more than the 2021 team. Denzel Valentine’s 2016 team converted from the line less often. These three teams all had great seasons, despite the trouble at the charity stripe.

So, let’s move onto the next factor, rebounding, which is summarized in Figure 3.

20210309%2BRebound.jpg

Figure 3: Comparison of the rebounding rate for the 2021 MSU team to other Tom Izzo coached teams

Rebounding rate is a little easy to understand. It is simply the percentage of missed shots that the team rebounds either on the offensive or defensive end of the floor. This is clearly a historical point of emphasis in the Michigan State program.

In 2021, rebounding seems to be a bit of a mixed bag. On the defensive end, this year’s team has a rate that is similar to the bulk of other Tom Izzo squads, if not a little better. The offensive glass, however, is a different story. The 2021 team is one of the worst offensive rebounding teams in the Tom Izzo era. It ranks right there with the 2004 team and the 2017 team, neither of which played in the second weekend of the NCAA Tournament.

Offensive rebounding does appear to be one of the key issues for this team. But, what about turnovers? That stat is summarized below in Figure 4.

20210309%2BTOs.jpg

Figure 4: Comparison of turnover rate for the 2021 MSU team to other Tom Izzo coached teams

Turnover rate is also fairly straightforward. It is simply the percentage of possessions per game that end in a turnover, for any reason. Surprisingly, the 2021 squad actually does a fairly good job at taking care of the ball, relative to former MSU teams. This year’s team certainly does not create a lot of turnovers, but they are in good company in this category. Both the 2019 and 2020 teams had similar profiles.

Now, I should mention that none of these turnover numbers are elite. No Tom Izzo team has ever finished in the top 70 nationally in avoiding turnovers or in the top 90 of creating them. The key point is that this year’s team in not noticeably worse than other MSU teams that went on to have great years.

When it comes to basketball, the most important thing to do is to make shots and to prevent the other team from making shots. For this reason, it is the last of the four factors, effective field goal percentage, that is the most important. That metric is summarized below in Figure 5.

20210309%2BeFG.jpg

Figure 5: Comparison of effective field goal percentage for the 2021 MSU team to other Tom Izzo coached teams

Note that effective field goal percentage is a weighted average of the shooting percentage of both two-point and three-point shots. Just a glance at Figure 5 seems to provide the answer that we have been looking for. The main problem with the 2021 MSU team is that they are not a good shooting team, and the effective field goal percentage defense is not great either.

It is oddly appropriate that the two teams that most resemble the current 2021 team are the squads from 2011 and 1997, which were similarly inefficient as the current team. I will point out that the 2009 team that made it to the Championship Game at Ford Field was only slightly better of a shooting (and defending team). However, the 2009 team was very strong in the other three areas, and thus were able to overcome their, on average, poor shooting and poor field goal percentage defense.

In order to break the shooting woes down a bit more, I made two additional figures: one for two-shooting and one for three-point shooting. Figure 6 below shows the shooting from the long line.

20210309%2B3PT.jpg

Figure 6: Comparison of the three-point field goal percentage for the 2021 MSU team to other Tom Izzo coached

As for three-point shooting, this is clearly a bad three-point shooting MSU team, but as the graph shows, other successful MSU teams, including three Final Four teams (1999, 2001, and 2010) are located in a similar part of the figure.

Furthermore, this year’s team is doing a good job at forcing opponents to shoot a relatively low percentage from three. In addition (though not shown here) MSU is also doing a good job limiting three-point attempts, relative to other Tom Izzo teams.

In other words, three-point shooting does not seem to be the main concern. How about two-point shooting? That is shown below in Figure 7.

20210309%2B2PT.jpg

Figure 7: Comparison of the two-point field goal percentage for the 2021 MSU team to other Tom Izzo coached

It appears that we have zeroed in on the main problem. Both offensively and defensively, this MSU team has struggled to both score and defend inside the three-point line. The 2021 team is the second worst two-point shooting team in the Izzo era, only ahead of the 2011 team, and only the 2004 team played worse two-point defense.

That said, I will end with a bit of more positive news. One thing that we have learned about the 2021 team is that they are inconsistent and shooting is perhaps the key symptom of that problem. That said, MSU’s two-point offense correlates extremely well to wins and losses this year. The difference is stark.

In games this year where Michigan State shoots better than 45 percent from two, the Spartans are 14-2. In games where MSU shoots under 45 percent from two, the record is 1-9.

Note that the two losses with over 45 percent shooting were the loss at Northwestern, where the Wildcats shot the lights out, and the home game versus Purdue that MSU fumbled away in the final 30 seconds.

On the defensive side of the ball, the trend is similar but not quite as stark. When MSU has given up over 50 percent shooting from two, the Spartans’ record is 2-8. When MSU held opponents at or below that mark, the record was 13-3.

On some level, this is not shocking. If a team shoots better or defends better they should win more often right? While that is true, this kind of night-and-day result is fairly unique. I spot checked several other teams and I could not find one with nearly this level of contrast in the results.

If we think about the arc of this season, the Spartans seemed to hit a rut around Christmas. They were in the process of pulling out of that rut when the COVID pause happened, and then they played a compressed schedule in the final two weeks with tired legs. Certainly there were a lot of games in which their shooting and field goal defense may have been compromised by external factors.

Now that those factors have been largely removed, is it reasonable to expect that Michigan State might be able to shoot better after a little rest and postseason tune up practice? I think that this might be possible or even probable. If this does happen, what is MSU’s ceiling?

I am not sure about you, but I am excited to find out.

Go Green.

MEN'S BASKETBALL Dr. G&W's Odds Update: I Feel Like Dancing

In retrospect, we really should have seen this coming.

Well, maybe that is a stretch. After all, the 2020-21 Michigan Sate Spartans were just 4-9 on Feb 17. Long-time Spartans fans had seen Tom Izzo-coached teams weather adversity in the first months of the season only to surge to greatness in closing weeks of the season. But this year, with this team, the hole seemed too deep.

There were so many reason to doubt this team. The players and staff suffered through COVID outbreaks, shooting slumps, and maddening inconsistency, and all of these things just happen to hit in a year when the Big Ten is the strongest conference of the entire Kenpom era. It also did not help that the Spartans just graduated one of the best point guards that has ever worn the Green and White in Cassius Winston. Tom Izzo is one of the greatest coaches of all time, but even he seemed to have no answers.

But then came the win at Indiana, followed by the wins over Illinois and Ohio State, and Spartans fans dared to hope. The Spartans faltered at Maryland, but closed out at the Hoosier at home to put themselves right at the doorstep of a very improbable bid to the NCAA Tournament. Finally, MSU was able earn a split with the Big Ten Champion Michigan Wolverines to drive the record to 9-11 in Big Ten play.

With three top-10 wins over less than a two-week span, Tom Izzo has done it. Again. At some point in the future, MSU will miss an NCAA Tournament. It will not be in 2021. I don’t know about you, but I feel like dancing.

For those listening closely to the words of Coach Izzo in the postgame press conferences, it is very clear that this team has struggled mightily with the extraordinary circumstances of this season. There is no doubt in my mind that there are stories that have gone untold about the things that have happened in Breslin Center behind closed doors. You can just see it on Coach Izzo’s face. Someday we might hear more about what really happened. Or, we may not.

For this reason, I do think that it is fair to say that, despite the record, this may be the best coaching job of Coach Izzo’s career. What I can also say for me personally is that I have never been so proud of a team that finished under .500 in conference play than I am of the 2020-21 Spartans. They needed a virtual miracle just to get into the NCAA Tournament bubble conservation. Over the past two weeks, they achieved that and more. And, they aren’t finished just yet.

Final Big Ten Standings

As the Big Ten regular season is now complete, there are no more expected wins or championship odds to calculate. Below is the final Big Ten enhanced standings.

Table 1: Final Big Ten enhanced standings
20210308%2BB1G%2BStand.jpg


From the enhanced Big Ten standings, the main thing to point out is that not only did Illinois beat the Wolverines badly head-to-head, the Fighting Illini also won two more Big Ten games, but officially finished in second place due to win percentage. It should come as no surprise that Illinois is a bit salty. Do the Illini have a legitimate gripe?

The problem is that Michigan played only 17 of the originally scheduled 20 conference games, while every other Big Ten team played at least 19. While Michigan would have been clearly favored in each of the cancelled games, two of those games were on the road, and as the Wolverines found out on Sunday, no road game can be taken for granted.

Based on the final Kenpom efficiencies, it is possible to project the spreads and odds for the Wolverines in each of the three cancelled games:
  • Michigan (-7) at Penn State (76 percent odds for Michigan to win)
  • Indiana at Michigan (-11.5, 87 percent odds)
  • Michigan at Northwestern (-11, 86 percent odds)
If we multiple those three odds together, we can say that the Wolverines only had about a 57 percent chance to sweep those three games. In other words, there was a 43 percent chance that the Wolverines would had lost a game, and that subsequently, Illinois would have earned at least a share of the Big Ten title.

If I were an Illini fan, those numbers would have me pretty upset as well. If Illinois were to beat Michigan again in the Big Ten Tournament, or if the Wolverines bow out early, this will only add fuel to the fire and bolster the Illini’s claim to the title.

For much of the season, Michigan was not only at the top of the standings, but they were also at the top in the category of “luck.” As Figure 1 below indicates, the Wolverines’ luck perhaps ran out in East Lansing.

20210308%2BB1G%2BLuck.jpg

Figure 1: Calculated final "luck" metric (actual wins minus expected wins)

In the final calculation, the Wolverines were the fourth most lucky team, behind Illinois, Purdue, and Michigan State. The Spartans were close to the bottom of the conference in luck until the final two weeks of the season, but the Green and White ended up as the luckiest team in the conference, based on this metric.

So, was MSU simply lucky to have won three games over top-five opponents in the last two weeks? Honestly, some luck and/or grit was certainly involved, but the odds of the Spartans beating Illinois, Ohio State, and Michigan based on the projected spreads is only one percent. Therefore, a more likely hypothesis is that the Spartans are simply a better team right now than their current Kenpom efficiency (which is an average over the entire season) would suggest. I believe that our eye balls are telling us the same thing.

In fact, in order to adjust the Spartans’ luck back to zero, MSU’s adjusted efficiency margin would have to be increased to almost +20.00, up from the current value of +15.50. This would increase MSU’s Kenpom ranking into the top 30 instead of the mid-50s where it is currently located. That feels about right, and if anything, might be a bit conservative on any given night.

Final Big Ten Strength of Schedule

It is also a good time to revisit the final strengths of schedule for the Big Ten, which are shown below in Figure 2.

20210308%2BB1G%2BSoS.jpg

Figure 2: Final Big Ten strengths of schedule assuming as average power five team played the schedule of each Big Ten team

In the final analysis, the two best teams in the conference, Illinois and Michigan, grade out to have the easiest overall conference schedules, even when Michigan’s three “easy” un-played games are removed from the equation. The Spartans finished with the third-hardest schedule in the conference, trailing only Minnesota and Northwestern.

A simple look at the schedule confirms this calculation. After all, Michigan and Illinois only played each other once and both teams also only played the third-ranked Big Ten team once (who is Iowa, at least according to Kenpom). But, all three of those teams also have the distinct advantage of not having to play themselves.

In my preseason analysis of the Big Ten schedule, I attempted to adjust for this factor by rerunning the calculation in a scenario where the strength of an average Big Ten team (in this case, Indiana) is artificially adjusted such that the Hoosiers are a good as the team in question.

In other words, when analyzing Michigan’s schedule, Indiana is “replaced” by a team as good as Michigan. Similarly, when analyzing Nebraska, Indiana is replaced by a team as “good” as the Cornhuskers. The final results of this calculation are shown below in Figure 3.

20210308%2BB1G%2BSoS%2Badj.jpg

Figure 3: Adjusted final Big Ten strengths of schedule

As we can see, even with this correction, Michigan and Illinois still had the two easiest schedules in the conference, while teams like Michigan State, Minnesota, and Northwestern still have the most difficult schedules. The only significant difference is that Purdue and Iowa’s strengths of schedule difficulties are closer to the average after this adjustment.

Simulating the Big Ten Tournament

Now that the regular season is finally in the rear view mirror, it is time to officially turn our focus to the postseason, starting with the Big Ten Tournament. The bracket is now set and it is shown below:

Login to view embedded media
The Spartans earned the No. 9 seed and will face No. 8 seed Maryland on Thursday at 11:30 a.m. EST. If the Spartans win, they will once against face Michigan in the quarterfinal round on Friday, also at 11:30 a.m. If the Spartans were to beat the Wolverines again, they would mostly likely face either Purdue or Ohio State on Saturday in the semifinals.

Throughout the regular season, I have been simulating the results of the Big Ten Tournament using the projected seeds. Now, it is finally time to present the results of the simulation using the actual seeds and final Kenpom efficiencies to estimate point spreads and win probabilities. The results are shown below in Table 2.

Table 2: Big Ten Tournament odds from a 50,000 cycle Monte Carlo simulation and in comparison to the Vegas odds.
20210308%2BBTT%2Bsim.jpg


Note that in the final column I have included the posted Vegas odds for each team to claim the postseason crown. As you can see, my simulated odds agree fairly closely with the Vegas odds.

In general, Vegas odds are a bit better than my simulated odds for two reasons. First, the Vegas odds do not sum to 100 percent and second, Vegas is less likely to make money if the true odds are better than the odds that they will have to pay out. As a first pass, a wager on one of the top three teams looks reasonable, while the odds for a wager on any of the other teams looks like a poor investment.

As for the Spartans, the table suggests that Michigan State only has a 40 percent chance to beat Maryland, a five percent chance to beat Michigan and advance to the semifinals, and only a 1-in-350 chance to win the Big Ten Tournament.

These numbers are accurate if we assume that MSU’s current Kenpom efficiency is a true representation of how good MSU is right now. In most years, this is likely a pretty good assumption. However, as we all know, 2021 is far from an ordinary year.

Based on the odds set by Vegas, the folks in the dessert that make money on knowing these probabilities clearly think that Michigan State has better odds than 1-in-350. In fact, MSU has the seventh-best odds in the conference at 25-to-1.

As a final thought experiment, I reran the Big Ten Tournament simulation using different assumed Kenpom efficiency margins for the Spartans to see how the odds might improve. I varied the efficiency margin from 15.5, where MSU is now, up to 32.5, which is slightly better than Michigan’s current efficiency margin. The results of this set of simulations is shown below in Figure 4.

20210308%2BBTT%2BMSU%2Bodds.jpg

Figure 4: MSU's odds to win the Big Ten Tournament is the Spartans' true efficiency is similar to other Big Ten teams

The figure suggests that even if Michigan State is in reality a No. 1 seed caliber team, the odds of winning the Big Ten Tournament are not great. If MSU’s efficiency is actually close to that of a team like Ohio State, the Spartans’ odds would only go up to around six percent. If the Spartans were as good as Illinois (or Iowa), the odds are just above 12 percent. If MSU is, in reality, better than Michigan, the odds are still under 20 percent.

This results tells us two things. First, winning the conference tournament in a year when the Big Ten is this strong is really, really hard. Second, getting the double bye and starting the tournament is a significant advantage.

One has to look no farther than the case of Michigan, whose odds are just over 30 percent. If I artificially inflate the Spartans’ efficiency to be similar to that of the Wolverines, MSU’s odds are roughly half, due to the harder draw and need to play an extra game. Once again, as Michigan taught us this year, the odds of losing are way lower if you simply don’t have to play the game.

That is all for today. Until next time, enjoy, and Go State, Beat the Terrapins!

Dillon Tatum Announces Final Four

Login to view embedded media

Login to view embedded media
Dillon Tatum has included the Spartans in his top four. The 5'11 185 ATH out of West Bloomfield (Mich.) released his top four on Twitter this afternoon. In addition to Michigan State, he also included Baylor, Michigan, and Notre Dame.


Login to view embedded media
ADVERTISEMENT

Filter

ADVERTISEMENT