

It always feels good to beat your rival. It feels better when you beat them at home by double-digits, and it feels even better when you can say that you have now beaten them 11 of the last 16 times. It is a good time in history to be a fan of the Michigan State Spartans basketball team.
My usual schedule is to provide an update on Michigan State’s expected win total, conference title odds, and Big Ten Tournament prospects about once a week. However, it seems fair to provide a quick update today on the impact of the Spartans’ big win as well as to take a sneak peek at the coming week, which is perhaps bigger than you might think.
Let’s start with a lightning round version of my typical odds update (note that this data is as of Jan. 31 and does not reflect the results of Penn State’s victory over Iowa on Monday night, which has minimal impact on the odds anyway).
Table 1: Updated odds to win or share the Big Ten title and the win distributions for those winning teams as of Jan. 31.
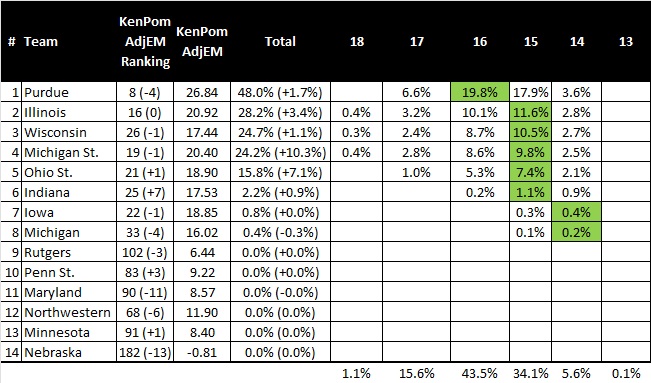
The Spartans clearly got a boost due to the results of this weekend. But the win over Michigan only added a few percentage points to Michigan State’s current odds of 24 percent, which is just behind Illinois and in a virtual tie with Wisconsin. The majority of the 10 percentage-point increase in odds was due to the announcement on Monday that the game in Ann Arbor with the Wolverines has been rescheduled for March 1. As a result, there are no longer any scenarios where a team could win or lose the title by a half game.
As for an update on the other notable statistics, I now have Michigan State’s expected conference win total at 13.67. The odds of winning 14 or more games are 55 percent. The odds of winning 15 or more games are 31 percent, and the odds of winning at least 16 games are 13 percent. A record of 16-4 or better is good enough to win the Big Ten regular season championship in over 90 percent of all scenarios.
The Spartans are still projected as the No. 3 or No. 4 seed in the Big Ten Tournament with just under a 70 percent chance to secure a top-four double-bye. Michigan State’s odds to win the Big Ten Tournament ticked up a couple of percentage points to 13 percent.
A few years back, @Carl_N pointed out on this board that this is a real effect. Carl showed data that over the last 20 years or so, Michigan State’s winning percentage took a noticeable dip in late January and early February. Carl dubbed this effect “Tom Izzo Bermuda Triangle.” It was a very nice analysis and insight from Carl (and I hope that I am correctly remembering the details!)
I decided to also dig into this phenomena from a few different angles. I have a good database of MSU game results and spread data back to the 2005-2006 season through the 2020-2021 season. I decided to study this effect using three factors: raw win percentage, performance against the spread and performance relative to the Las Vegas spread expectation (which I will explain a bit later).
Let’s start with the raw win percentage and the performance against the spread data in Figure 1.
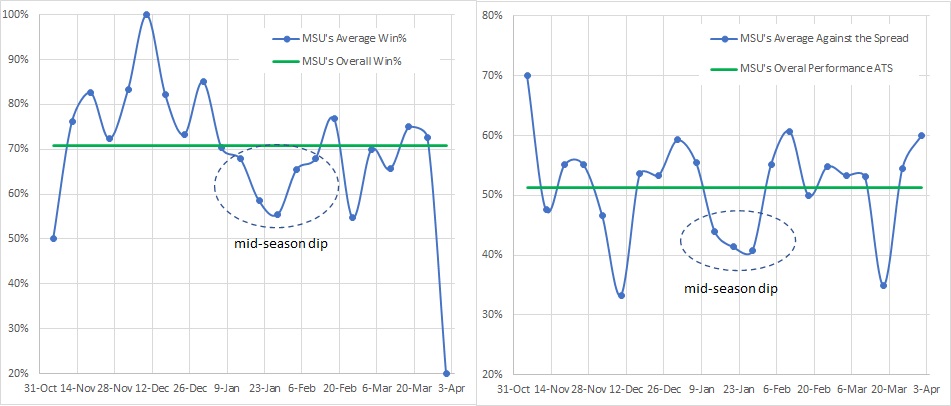
Figure 1: Michigan State's raw win percentage (left panel) and performance against the final Vegas line (right panel) for the 2006-2021 seasons as a function of time (days from the beginning of season).
In these two figures, I am calculating the seven-day average of the Spartans’ performance for the 2006 to the 2021 season. Over this span and overall, Michigan State has won slightly more than 70 percent of its games straight up and is just over 50 percent against the spread. These average values are shown as the green, horizontal line on each graph for reference.
While the data in both graphs fluctuates, there is only one part of each graph where there are several data points in a row that deviate noticeably from the average. The area of each graph is highlighted with the dashed oval and it spans a roughly three-week period from mid-January to the early part of February. During this time, on average, the Spartans’ raw win percentage and performance against the spread dip by about 10 percentage points. This is the “Tom Izzo Bermuda Triangle.”
But raw win percentage and covering the spread (or not) is perhaps not the best metric. The former does not account for the strength of the opponent and the latter does not account for winning or losing. Both metrics are also binary (either “win” or “lose”), which makes quantification more challenging.
Therefore, I decided to run the numbers one more way that combines the best of both worlds. For each Michigan State game back to 2006, it is possible to calculate the odds that MSU should have won each of those games based on the final Vegas line. This “performance (a win or a loss) against the Vegas expectation” (or PAVE) is a scaled metric that accounts for winning and losing and the strength of the opponent. In my weekly odds update, this is essentially equivalent to the metric that I refer to as “luck.”
In order to understand the PAVE metric, consider a situation where Michigan State is a 13-point favorite in a game. The odds of a Spartan win are 90 percent, based on historical data. If the Spartans win that game, it is just slightly better than expected. Mathematically, I would credit Michigan State with +0.1 of a win (or 1.0 minus 0.9) over expectation. However, if the Spartans were to lose that game, it would be a big hit. In this case the game would count as -0.9 of a win (or 0.0 minus 0.9).
In cases where the Spartans are a big underdog, the situation is reversed. In a game where Michigan State is a 13-point underdog, an upset win would earn the Green and White +0.9 of a win, but a loss would only subtract 0.1 of a win from the total. Games that are near toss-ups simply add or subtract roughly 0.5 of a win, depending on the exact spread.
Using this method, it is possible to track the Spartans trajectory, relative to expectation, throughout the course of each season. The best representation of the data that I could think of was to track the cumulative average PAVE metric as a function of the number of days from the beginning of the season. That data is shown below in Figure 2, and it is striking.
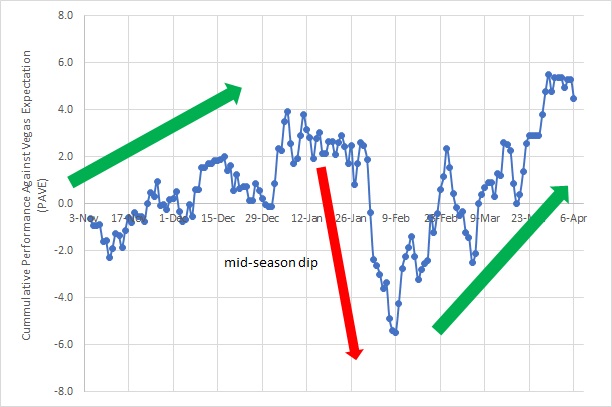
Figure 2: Cumulative average PAVE for Michigan State for the 2006-2021 seasons as a function of days from the start of the season.
The graph above appears to accurately trace the trajectory of an “average” Michigan State season. The first few games can be a bit rough, but then momentum (and the number of wins) starts to build into the start of the new year. The metric holds steady in early January, but in late January or early February, there is a crash. Then, there is a strong surge where the Spartans tend to overachieve for the rest of the season, right into March Madness.
Sounds familiar, right?
Granted, there are bumps along the road. There seems to be a dip right before Christmas and another dip right at the end of February, but the overall shape of the curve is very telling.
There is also a lot of variance in the data from year to year. Some years don’t follow this pattern at all, but more than half do. Figure 3 below shows the PAVE data for nine selected individual years back to 2007.
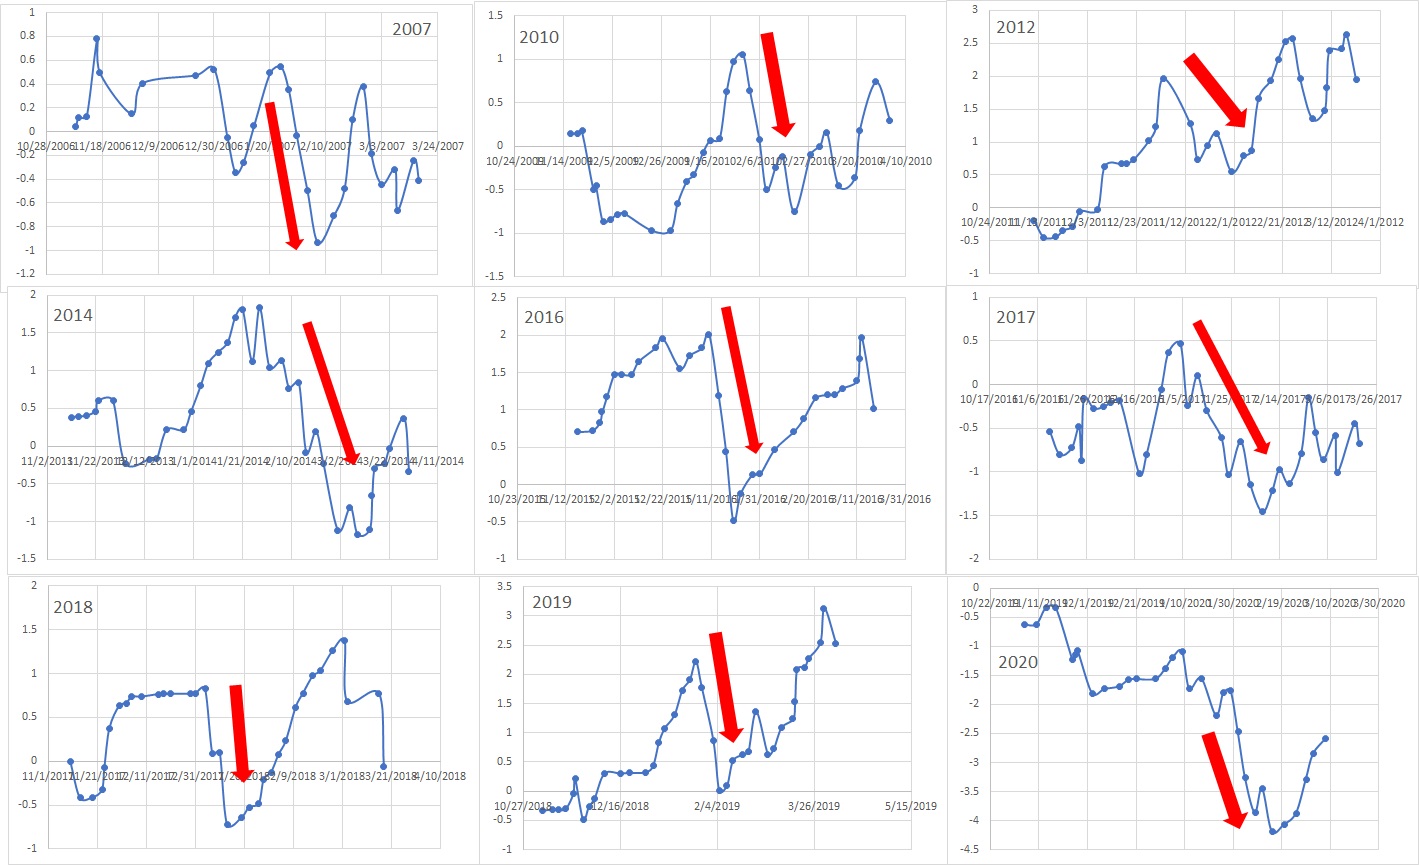
Figure 3: Cumulative PAVE for a series of individual Michigan State seasons.
In each case I have highlighted the apparent “mid-season dip.” It tends to start and end at slightly different times and has lasted for less than a week or over a month. Taken together, however, it is possible to define, on average, when the “Tom Izzo Bermuda Triangle” occurs:
On average, it starts on Jan. 18 and lasts until Feb. 6, or for about 19 days. Figure 2 also implies that it is most severe during the first week of February — or in other words, right now.
In situations like these, it is always hard to separate cause, effect and mere coincidence. That said, my scientific training tells me that there is a trend here and that there is likely something behind it. My working hypothesis is that it relates to the way that Coach Izzo structures his program. I think that there is a method to his brilliance, whether he realizes it or not.
The beginning stage of the season is when Coach Izzo and the staff just try to understand what pieces that they have and how they fit together. In mid-season, Izzo goes into the lab and starts to tinker. He understands his team and he is trying to figure out how to get the most out of his players. Izzo is trying to tighten the screws in order to optimize his squad’s output. This is when the dip tends to happen. It is a mid-season set of growing pains.
Once February hits in earnest, Izzo shifts into full postseason mode. He knows what he has and has pushed his players to be the best possible versions of themselves for the given year. At this point, it is time to just turn them loose. It doesn’t always work, but the trophy case in Breslin Center is a pretty good indicator of the success of this “strategy.”
If nothing else, Figure 2 gives a very quantitative measure of this success. Over the past 16 seasons, the Spartans have won a total of 11 games more than the Vegas lines projected from Feb. 9 to the end of the year. I doubt any other team or coach in the country could boast such an accomplishment.
As for the remainder of the 2021 season, this analysis can perhaps give us a preview of what to expect. Figure 4 below shows the projected point spreads and win probabilities for the Spartans’ remaining schedule.
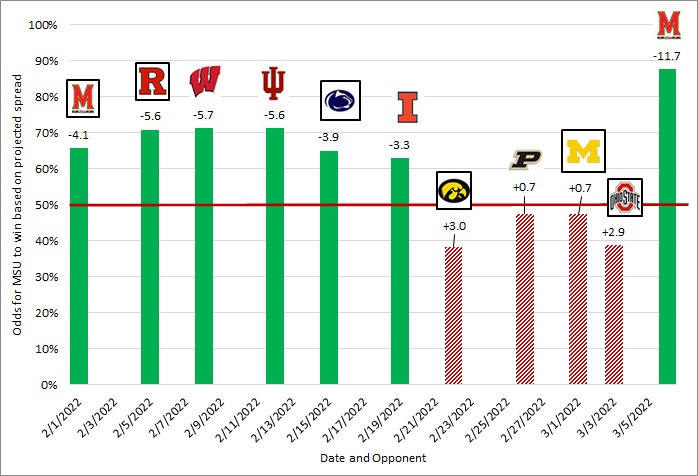
Figure 3: Odds for MSU to win the remaining Big Ten games, based on Kenpom efficiency margin.
At first glance, this looks promising. MSU is projected to be the favorite in the next six games. But, historically, the Spartans tend to underachieve — sometimes badly — in early February. The next two road games at Maryland and at Rutgers look like they should be wins. History tells me that these games are big trouble. Can the Spartans buck that trend in 2022?
The probabilities shown in Figure 3 suggest that, nominally, Michigan State would only be expected to win four of the next six games. History suggests the total might not be that high. Despite the emotional win over Michigan, the Spartans are right in the middle of the Bermuda Triangle. Weird things may continue to happen. I would not be shocked to see the Spartans drop two or even three games in that stretch.
The good news, however, is that the toughest stretch of the season occurs right as Michigan State is typically starting to peak. If the Spartans can weather the storm of the next week or so, I do believe that a strong finish to the season is certainly possible, if not likely.
I could easily see Michigan State entering the home game with Illinois on Feb. 19 with a 10-4 conference record and most pundits and fans counting Michigan State out of the Big Ten race. However, I could also imagine MSU getting hot and rattling off five (or even all six) wins in a row to share the title at 15-5 or 16-4.
The math suggests a 3-3 split of the final six games on the schedule is the most likely result, at least for your average college basketball team. But as Michigan State fans know, MSU in late February and March is far from average. Izzo simply laughs in the face of mathematics, at least one he clears the Bermuda Triangle.
So hold on tight, MSU fans. It might be bumpy over the next few weeks, but it is likely to turn out OK in the end. The skipper has traversed this course before and he knows what he is doing.
That is all for today. Until next time, enjoy, and Go Green!
My usual schedule is to provide an update on Michigan State’s expected win total, conference title odds, and Big Ten Tournament prospects about once a week. However, it seems fair to provide a quick update today on the impact of the Spartans’ big win as well as to take a sneak peek at the coming week, which is perhaps bigger than you might think.
Let’s start with a lightning round version of my typical odds update (note that this data is as of Jan. 31 and does not reflect the results of Penn State’s victory over Iowa on Monday night, which has minimal impact on the odds anyway).
Updated Big Ten Odds
With the win over the Wolverines on Saturday and the other weekend action, here are the updated odds for each team to or share the Big Ten regular season title.Table 1: Updated odds to win or share the Big Ten title and the win distributions for those winning teams as of Jan. 31.
The Spartans clearly got a boost due to the results of this weekend. But the win over Michigan only added a few percentage points to Michigan State’s current odds of 24 percent, which is just behind Illinois and in a virtual tie with Wisconsin. The majority of the 10 percentage-point increase in odds was due to the announcement on Monday that the game in Ann Arbor with the Wolverines has been rescheduled for March 1. As a result, there are no longer any scenarios where a team could win or lose the title by a half game.
As for an update on the other notable statistics, I now have Michigan State’s expected conference win total at 13.67. The odds of winning 14 or more games are 55 percent. The odds of winning 15 or more games are 31 percent, and the odds of winning at least 16 games are 13 percent. A record of 16-4 or better is good enough to win the Big Ten regular season championship in over 90 percent of all scenarios.
The Spartans are still projected as the No. 3 or No. 4 seed in the Big Ten Tournament with just under a 70 percent chance to secure a top-four double-bye. Michigan State’s odds to win the Big Ten Tournament ticked up a couple of percentage points to 13 percent.
Beware the Tom Izzo Bermuda Triangle
Prior to the win over the Wolverines this past weekend, the Spartans had lost two of the past three games in frustrating fashion (losing to Northwestern by two points and losing to Illinois by one point). To fans, it feels like Michigan State does this almost every year. It is the very nature of college basketball that good teams sometimes take bad losses. It happens. However, it is the timing of the skid that feels so familiar.A few years back, @Carl_N pointed out on this board that this is a real effect. Carl showed data that over the last 20 years or so, Michigan State’s winning percentage took a noticeable dip in late January and early February. Carl dubbed this effect “Tom Izzo Bermuda Triangle.” It was a very nice analysis and insight from Carl (and I hope that I am correctly remembering the details!)
I decided to also dig into this phenomena from a few different angles. I have a good database of MSU game results and spread data back to the 2005-2006 season through the 2020-2021 season. I decided to study this effect using three factors: raw win percentage, performance against the spread and performance relative to the Las Vegas spread expectation (which I will explain a bit later).
Let’s start with the raw win percentage and the performance against the spread data in Figure 1.
Figure 1: Michigan State's raw win percentage (left panel) and performance against the final Vegas line (right panel) for the 2006-2021 seasons as a function of time (days from the beginning of season).
In these two figures, I am calculating the seven-day average of the Spartans’ performance for the 2006 to the 2021 season. Over this span and overall, Michigan State has won slightly more than 70 percent of its games straight up and is just over 50 percent against the spread. These average values are shown as the green, horizontal line on each graph for reference.
While the data in both graphs fluctuates, there is only one part of each graph where there are several data points in a row that deviate noticeably from the average. The area of each graph is highlighted with the dashed oval and it spans a roughly three-week period from mid-January to the early part of February. During this time, on average, the Spartans’ raw win percentage and performance against the spread dip by about 10 percentage points. This is the “Tom Izzo Bermuda Triangle.”
But raw win percentage and covering the spread (or not) is perhaps not the best metric. The former does not account for the strength of the opponent and the latter does not account for winning or losing. Both metrics are also binary (either “win” or “lose”), which makes quantification more challenging.
Therefore, I decided to run the numbers one more way that combines the best of both worlds. For each Michigan State game back to 2006, it is possible to calculate the odds that MSU should have won each of those games based on the final Vegas line. This “performance (a win or a loss) against the Vegas expectation” (or PAVE) is a scaled metric that accounts for winning and losing and the strength of the opponent. In my weekly odds update, this is essentially equivalent to the metric that I refer to as “luck.”
In order to understand the PAVE metric, consider a situation where Michigan State is a 13-point favorite in a game. The odds of a Spartan win are 90 percent, based on historical data. If the Spartans win that game, it is just slightly better than expected. Mathematically, I would credit Michigan State with +0.1 of a win (or 1.0 minus 0.9) over expectation. However, if the Spartans were to lose that game, it would be a big hit. In this case the game would count as -0.9 of a win (or 0.0 minus 0.9).
In cases where the Spartans are a big underdog, the situation is reversed. In a game where Michigan State is a 13-point underdog, an upset win would earn the Green and White +0.9 of a win, but a loss would only subtract 0.1 of a win from the total. Games that are near toss-ups simply add or subtract roughly 0.5 of a win, depending on the exact spread.
Using this method, it is possible to track the Spartans trajectory, relative to expectation, throughout the course of each season. The best representation of the data that I could think of was to track the cumulative average PAVE metric as a function of the number of days from the beginning of the season. That data is shown below in Figure 2, and it is striking.
Figure 2: Cumulative average PAVE for Michigan State for the 2006-2021 seasons as a function of days from the start of the season.
The graph above appears to accurately trace the trajectory of an “average” Michigan State season. The first few games can be a bit rough, but then momentum (and the number of wins) starts to build into the start of the new year. The metric holds steady in early January, but in late January or early February, there is a crash. Then, there is a strong surge where the Spartans tend to overachieve for the rest of the season, right into March Madness.
Sounds familiar, right?
Granted, there are bumps along the road. There seems to be a dip right before Christmas and another dip right at the end of February, but the overall shape of the curve is very telling.
There is also a lot of variance in the data from year to year. Some years don’t follow this pattern at all, but more than half do. Figure 3 below shows the PAVE data for nine selected individual years back to 2007.
Figure 3: Cumulative PAVE for a series of individual Michigan State seasons.
In each case I have highlighted the apparent “mid-season dip.” It tends to start and end at slightly different times and has lasted for less than a week or over a month. Taken together, however, it is possible to define, on average, when the “Tom Izzo Bermuda Triangle” occurs:
On average, it starts on Jan. 18 and lasts until Feb. 6, or for about 19 days. Figure 2 also implies that it is most severe during the first week of February — or in other words, right now.
What’s Next For Michigan State?
So, what does all this mean?In situations like these, it is always hard to separate cause, effect and mere coincidence. That said, my scientific training tells me that there is a trend here and that there is likely something behind it. My working hypothesis is that it relates to the way that Coach Izzo structures his program. I think that there is a method to his brilliance, whether he realizes it or not.
The beginning stage of the season is when Coach Izzo and the staff just try to understand what pieces that they have and how they fit together. In mid-season, Izzo goes into the lab and starts to tinker. He understands his team and he is trying to figure out how to get the most out of his players. Izzo is trying to tighten the screws in order to optimize his squad’s output. This is when the dip tends to happen. It is a mid-season set of growing pains.
Once February hits in earnest, Izzo shifts into full postseason mode. He knows what he has and has pushed his players to be the best possible versions of themselves for the given year. At this point, it is time to just turn them loose. It doesn’t always work, but the trophy case in Breslin Center is a pretty good indicator of the success of this “strategy.”
If nothing else, Figure 2 gives a very quantitative measure of this success. Over the past 16 seasons, the Spartans have won a total of 11 games more than the Vegas lines projected from Feb. 9 to the end of the year. I doubt any other team or coach in the country could boast such an accomplishment.
As for the remainder of the 2021 season, this analysis can perhaps give us a preview of what to expect. Figure 4 below shows the projected point spreads and win probabilities for the Spartans’ remaining schedule.
Figure 3: Odds for MSU to win the remaining Big Ten games, based on Kenpom efficiency margin.
At first glance, this looks promising. MSU is projected to be the favorite in the next six games. But, historically, the Spartans tend to underachieve — sometimes badly — in early February. The next two road games at Maryland and at Rutgers look like they should be wins. History tells me that these games are big trouble. Can the Spartans buck that trend in 2022?
The probabilities shown in Figure 3 suggest that, nominally, Michigan State would only be expected to win four of the next six games. History suggests the total might not be that high. Despite the emotional win over Michigan, the Spartans are right in the middle of the Bermuda Triangle. Weird things may continue to happen. I would not be shocked to see the Spartans drop two or even three games in that stretch.
The good news, however, is that the toughest stretch of the season occurs right as Michigan State is typically starting to peak. If the Spartans can weather the storm of the next week or so, I do believe that a strong finish to the season is certainly possible, if not likely.
I could easily see Michigan State entering the home game with Illinois on Feb. 19 with a 10-4 conference record and most pundits and fans counting Michigan State out of the Big Ten race. However, I could also imagine MSU getting hot and rattling off five (or even all six) wins in a row to share the title at 15-5 or 16-4.
The math suggests a 3-3 split of the final six games on the schedule is the most likely result, at least for your average college basketball team. But as Michigan State fans know, MSU in late February and March is far from average. Izzo simply laughs in the face of mathematics, at least one he clears the Bermuda Triangle.
So hold on tight, MSU fans. It might be bumpy over the next few weeks, but it is likely to turn out OK in the end. The skipper has traversed this course before and he knows what he is doing.
That is all for today. Until next time, enjoy, and Go Green!
