

The calendar says that it is summer time, but the 2022-2023 college football season is right around the corner. For over 20 years, I have been refining various mathematical tools that I use to understand and project the trajectory of the college football season. I have once again run the numbers for the upcoming season and I am ready to start sharing the results, starting with an overview of the Michigan State Spartans.
Before digging into the numbers for MSU, I would like to provide a brief overview of my methodology and to set the table for the analysis to come over the next several weeks.
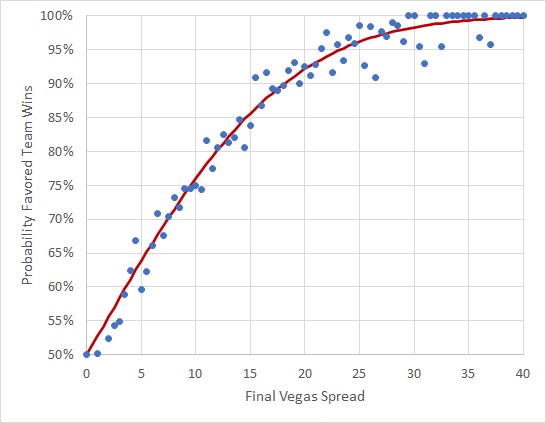
Figure 1: Correlation between the final Vegas point spread and the odds that the favored team wins straight-up. This data includes all available data from 2001-2021 (almost 15,000 games) courtesy of the prediction tracker website.
Point spread data is very predictive, but it is only available for a specific game a few days before kickoff. Therefore, a system is needed that can predict the point spread for any arbitrary football matchup and venue. Fortunately, over the years I have developed just such a system using only final score and location data as the inputs.
With this system in place, one only needs the schedule information for all 131 FBS teams and then it is possible to perform calculations on strengths of schedule and the odds for teams to win any number of games. More advanced simulations can generate season odds such as the odds for a team to win its division, conference, make the College Football Playoff (using some assumptions) and to win the national championship.
My methodology works quite well by itself once the season starts and each team has played a few games. However, at or near the beginning of the season, it is necessary to use some preseason estimates as to the strength of each team to anchor the data. For this input, I use an average of the full FBS preseason rankings from as many sources as I can find. This year, I pulled data from ESPN’s FPI, S&P+, Lindys, Athlon, Phil Steele and Pro Football Focus. As the season progresses, the influence of these preseason rankings are steadily reduced and finally eliminated from the calculations.
All of the analyses that I have mentioned so far can often be found in other places. However, my method has one unique feature that makes it far more accurate than the odds and numbers generated by systems such as ESPN’s FPI. My method explicitly considers the uncertainty in the preseason rankings themselves. The historical data suggests that preseason rankings are only accurate within about 20 slots in either direction. When this known uncertainty is included in the full season simulation, much more accurate statistics can be generated.
As a practical example, Michigan State was only projected to win about four games last year based on the preseason rankings, which varied from No. 51 to No. 87 in various publications. When all of the other sources calculated the probability for the Spartans to win 10 or more games, the odds worked out to roughly 1-in-30,000. If this were correct, Michigan State’s actual 2021 season would have been so rare that it would have been expected to happen only once in over 200 seasons.
However, if the known uncertainty of the preseason rankings were considered, the odds of the 2021 Spartans winning 10 or more games rose to around 1-in-95. While this is still quite rare, it is on the order of something that would happen to one or two teams every year, which is much more reasonable.
The methods outlined above do a good job of generating accurate odds for the full season, but at the end of the day there is only one scenario that will actually occur in reality. To this end, part of my process is to project the final records of each team using two different strategies.
In my base case, I simply project the final records based on the scenario where the projected favorite team wins every single game. This is technically the single most likely scenario (out of an astronomically large number of scenarios), but it is still not that likely.
I also perform what I call a “disruptive” simulation where I artificially introduce a historically reasonable number of upsets (about 25 percent of games) with an emphasis on home underdogs. Comparing the results of my base and disruptive simulation provides some insight as to which games might have the most impact on the overall college football season.
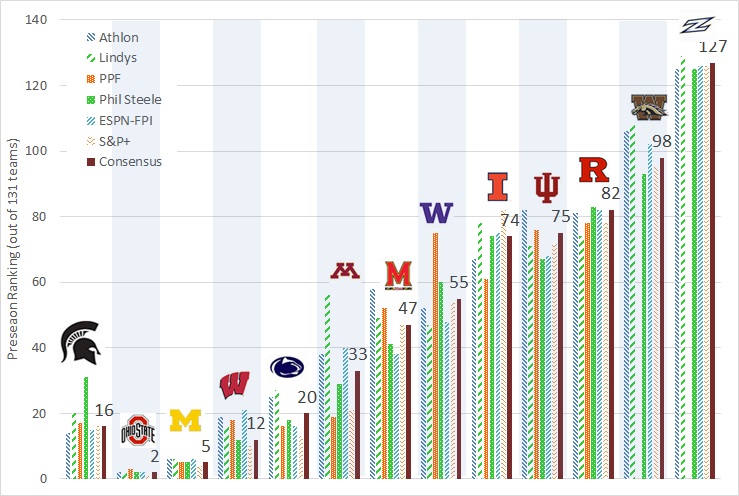
Figure 2: Summary of the preseason ranking by six of the most prominent sources for Michigan State and all 12 of the Spartans' opponents. The far right bar in each cluster is the consensus ranking, based on the average of the six systems.
Figure 2 is a bit of an eye chart, but it does give some initial perspective on the Spartans’ 2022 schedule. First of all, Michigan State’s preseason ranking is fairly consistent, with five of the six sources placing the Green and White somewhere between No. 14 and No. 20 overall. The lone exception is Phil Steele, who ranks Michigan State at No. 31.
As for Michigan State’s opponents, only Ohio State (consensus rank No. 2) and Michigan (No. 5) are clearly ranked ahead of the Spartans. After that, Wisconsin (No. 12) and Penn State (No. 20) are ranked similarly to Michigan State. The different preseason rankings have varying opinions as to the strength of those three teams and thus the averages put the Spartans right in the middle.
The preseason rankings for Minnesota are even more erratic. Most sources have Michigan State clearly ahead of the Gophers. But Pro Football Focus has the Spartans just two slots ahead of the Gophers, and Phil Steele has Minnesota two slots ahead of Michigan State.
As we continue moving left to right across the schedule, Maryland (No. 47) and Washington (No. 55) project as the next two toughest opponents, and there is a bit more consensus as to the strength of these teams. No source has Maryland ranked better than No. 38 and no source has the Huskies higher than No. 48.
The Spartans’ next three opponents, Illinois (No. 74), Indiana (No. 75) and Rutgers (No. 82) are all ranked similarly, with Western Michigan (No. 98) a half step back from this trio. Bringing up the rear this year is Akron (No. 127 of 131), which is picked to finish last in the MAC East.
With the data from Figure 2 as an input, along with Michigan State’s schedule and the historical uncertainty in every team’s ranking, I simulated the Spartans’ season 240,000 times. The results of this simulation provided a projection of the odds for Michigan State to win each of the 12 games on the schedule. Using Figure 1, these probabilities can be converted into projected point spreads. These data points are summarized below in Figure 3.
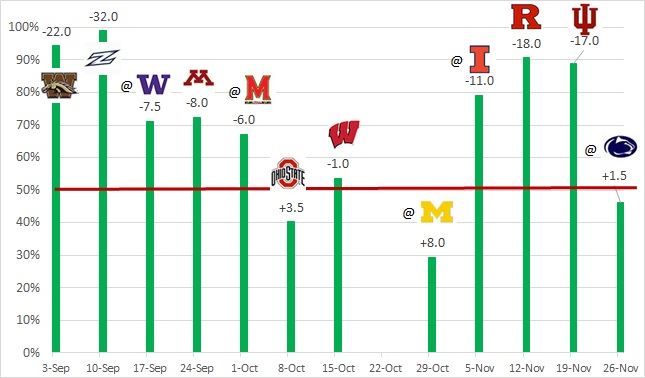
Figure 3: Projected win probabilities and point spreads for Michigan State's 2022 football season, based on the results of a 240,000 full season Monte Carlo simulation, including the impact of preseason ranking uncertainty.
From Figure 3, it is possible to gain a better understanding of the way Michigan State’s season is likely to play out. I will note here that this year I rank Michigan State’s overall schedule as the No. 25 most difficult in the FBS (good for sixth place in the Big Ten). The Spartans’ conference-only schedule is ranked fifth in the Big Ten. I will delve deeper into strength of schedule data in the next installment of this series.
As expected, Michigan State is projected to be huge favorites in its first two home games against MAC opponents: Western Michigan and Akron. The three games after that (at Washington, versus Minnesota and at Maryland) all project to have MSU favored by roughly a touchdown.
While that sounds positive, the math suggests that the Spartans will most likely go 4-1 in that opening stretch, even if we assume that Michigan State is truly a top-20 caliber team. A 4-1 start would not be the end of the world. In contrast, if the Spartans can go 5-0 to open the season, it will be a very good sign.
Following the road game at Maryland, Michigan State enters a mid-season gauntlet where it plays Ohio State, Wisconsin and at Michigan over a four-week period. The Spartans project to be underdogs against the Buckeyes and Wolverines, and the game with the Badgers looks like a toss-up.
The math for this three-game stretch suggests that the Spartans will most likely go 1-2. Obviously, the home game versus Wisconsin is the most likely win, but the Ohio State game is also at home, and Michigan State always plays Michigan tough, home or away. A record of 2-1 in this stretch is not outlandish, nor is a record of 0-3.
Following the game versus Michigan, the Spartans have drawn three games that all look quite winnable: at Illinois, and home games against Indiana and Rutgers. Michigan State currently projects to be a double-digit favorite in all three games, but the odds of winning all three games is only around 65 percent.
Michigan State closes out the regular season with a near toss-up contest at Penn State. When the final four games of the season are considered together, MSU is most likely to finish 3-1 in the home stretch. Obviously the Penn State game is the most likely loss, but it is very reasonable that the Spartans could defeat the Nittany Lions, but stub their toe in Champaign against Illinois (for example).
In total, the analysis above leads to the conclusion that Michigan State will most likely finish the regular season with a record of 8-4. However, the results of the full-season simulation provide a more accurate account of the Spartans’ possible win distribution. Figure 4 below shows the results of these simulations.
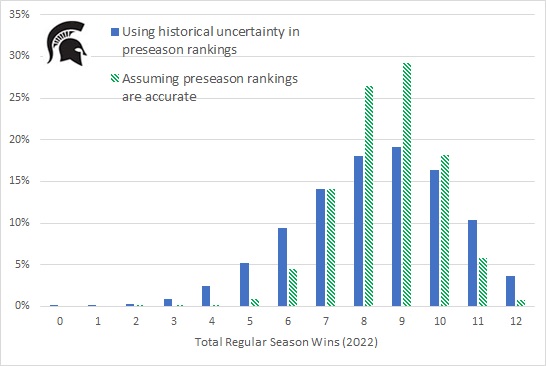
Figure 4: Win total distribution for the 2022 Michigan State football regular season. The solid green bars some the "true" distribution, which takes into account preseason rankings uncertainty. The blue striped bars show the distribution if the preseason rankings are assumed to be correct, which is the case with most analyses done by others.
Figure 4 compares two different sets of data, both of which try to answer the same question: how many games will Michigan State win in 2022? The blue and white striped bars give the results of a calculation that assumes that the preseason rankings are correct. This is essentially the same data that every other website will provide. But, these numbers are not accurate.
The solid green bars represent the results of my simulation of the full season with the known uncertainty of the preseason rankings taken into account. As I have shown previously, this analysis does give accurate results. The overall shape and position of both distributions is essentially the same, but the more accurate green distribution is more broad.
This more precise analysis reveals that the expected win total for the Spartans is 8.32. Interestingly, the math suggests that a nine-win season is the most likely single outcome. The data also suggests that there is a 50-50 chance that Michigan State finishes with between eight and 10 wins total.
My analysis gives the Spartans a 3.6 percent chance to run the table at 12 wins. On the other hand, the math also says that there is an 8.9 percent chance that Michigan State fails to win five games and stays home for the holidays. In these two extreme cases, the Spartans are either quite a bit better or quite a bit worse than the preseason rankings suggest.
While Figure 4 gives an accurate picture of the overall season odds for Michigan State, Figure 3 also suggests that the Spartans will be favored in nine of the team’s 12 total games. This simple analysis agrees with Figure 4 in that the most likely single outcome is for MSU to finish at 9-3.
That said, in my disruptive simulation of the season, the Spartans edge the Buckeyes at home and finish the season at 10-2. As we will see in the next installment of this series, this potential upset could have major implications in the overall Big Ten race.
As for other season odds for the Spartans, my simulation gives Michigan State a 13.2 percent chance to win the Big Ten East, an 8.2 percent chance to win the Big Ten title, a similar 8.1 percent chance to make the College Football Playoff and a 1.8 percent chance to win the national title.
How do these numbers compare to the rest of the Big Ten? That will be the subject of Part Two of this six-part math-based preview. Stay tuned.
Before digging into the numbers for MSU, I would like to provide a brief overview of my methodology and to set the table for the analysis to come over the next several weeks.
Methodology Overview
The core concept behind my analysis is that the odds that any team will win or lose a football game is defined very accurately by the point spread. That correlation is shown below in Figure 1. Essentially the point spread accurately predicts the final margin of victory of the favored team on average, but with a high standard deviation of 14 points.
Figure 1: Correlation between the final Vegas point spread and the odds that the favored team wins straight-up. This data includes all available data from 2001-2021 (almost 15,000 games) courtesy of the prediction tracker website.
Point spread data is very predictive, but it is only available for a specific game a few days before kickoff. Therefore, a system is needed that can predict the point spread for any arbitrary football matchup and venue. Fortunately, over the years I have developed just such a system using only final score and location data as the inputs.
With this system in place, one only needs the schedule information for all 131 FBS teams and then it is possible to perform calculations on strengths of schedule and the odds for teams to win any number of games. More advanced simulations can generate season odds such as the odds for a team to win its division, conference, make the College Football Playoff (using some assumptions) and to win the national championship.
My methodology works quite well by itself once the season starts and each team has played a few games. However, at or near the beginning of the season, it is necessary to use some preseason estimates as to the strength of each team to anchor the data. For this input, I use an average of the full FBS preseason rankings from as many sources as I can find. This year, I pulled data from ESPN’s FPI, S&P+, Lindys, Athlon, Phil Steele and Pro Football Focus. As the season progresses, the influence of these preseason rankings are steadily reduced and finally eliminated from the calculations.
All of the analyses that I have mentioned so far can often be found in other places. However, my method has one unique feature that makes it far more accurate than the odds and numbers generated by systems such as ESPN’s FPI. My method explicitly considers the uncertainty in the preseason rankings themselves. The historical data suggests that preseason rankings are only accurate within about 20 slots in either direction. When this known uncertainty is included in the full season simulation, much more accurate statistics can be generated.
As a practical example, Michigan State was only projected to win about four games last year based on the preseason rankings, which varied from No. 51 to No. 87 in various publications. When all of the other sources calculated the probability for the Spartans to win 10 or more games, the odds worked out to roughly 1-in-30,000. If this were correct, Michigan State’s actual 2021 season would have been so rare that it would have been expected to happen only once in over 200 seasons.
However, if the known uncertainty of the preseason rankings were considered, the odds of the 2021 Spartans winning 10 or more games rose to around 1-in-95. While this is still quite rare, it is on the order of something that would happen to one or two teams every year, which is much more reasonable.
The methods outlined above do a good job of generating accurate odds for the full season, but at the end of the day there is only one scenario that will actually occur in reality. To this end, part of my process is to project the final records of each team using two different strategies.
In my base case, I simply project the final records based on the scenario where the projected favorite team wins every single game. This is technically the single most likely scenario (out of an astronomically large number of scenarios), but it is still not that likely.
I also perform what I call a “disruptive” simulation where I artificially introduce a historically reasonable number of upsets (about 25 percent of games) with an emphasis on home underdogs. Comparing the results of my base and disruptive simulation provides some insight as to which games might have the most impact on the overall college football season.
Michigan State Season Overview
With that primer in hand, let us now turn our focus onto the 2022 Michigan State football season, starting with the Green and White’s ranking and schedule. Figure 2 below summarizes MSU’s preseason rankings in all of the sources that I used this year, as well as the preseason rankings for all 12 of the Spartans’ opponents, from strongest to weakest.
Figure 2: Summary of the preseason ranking by six of the most prominent sources for Michigan State and all 12 of the Spartans' opponents. The far right bar in each cluster is the consensus ranking, based on the average of the six systems.
Figure 2 is a bit of an eye chart, but it does give some initial perspective on the Spartans’ 2022 schedule. First of all, Michigan State’s preseason ranking is fairly consistent, with five of the six sources placing the Green and White somewhere between No. 14 and No. 20 overall. The lone exception is Phil Steele, who ranks Michigan State at No. 31.
As for Michigan State’s opponents, only Ohio State (consensus rank No. 2) and Michigan (No. 5) are clearly ranked ahead of the Spartans. After that, Wisconsin (No. 12) and Penn State (No. 20) are ranked similarly to Michigan State. The different preseason rankings have varying opinions as to the strength of those three teams and thus the averages put the Spartans right in the middle.
The preseason rankings for Minnesota are even more erratic. Most sources have Michigan State clearly ahead of the Gophers. But Pro Football Focus has the Spartans just two slots ahead of the Gophers, and Phil Steele has Minnesota two slots ahead of Michigan State.
As we continue moving left to right across the schedule, Maryland (No. 47) and Washington (No. 55) project as the next two toughest opponents, and there is a bit more consensus as to the strength of these teams. No source has Maryland ranked better than No. 38 and no source has the Huskies higher than No. 48.
The Spartans’ next three opponents, Illinois (No. 74), Indiana (No. 75) and Rutgers (No. 82) are all ranked similarly, with Western Michigan (No. 98) a half step back from this trio. Bringing up the rear this year is Akron (No. 127 of 131), which is picked to finish last in the MAC East.
With the data from Figure 2 as an input, along with Michigan State’s schedule and the historical uncertainty in every team’s ranking, I simulated the Spartans’ season 240,000 times. The results of this simulation provided a projection of the odds for Michigan State to win each of the 12 games on the schedule. Using Figure 1, these probabilities can be converted into projected point spreads. These data points are summarized below in Figure 3.
Figure 3: Projected win probabilities and point spreads for Michigan State's 2022 football season, based on the results of a 240,000 full season Monte Carlo simulation, including the impact of preseason ranking uncertainty.
From Figure 3, it is possible to gain a better understanding of the way Michigan State’s season is likely to play out. I will note here that this year I rank Michigan State’s overall schedule as the No. 25 most difficult in the FBS (good for sixth place in the Big Ten). The Spartans’ conference-only schedule is ranked fifth in the Big Ten. I will delve deeper into strength of schedule data in the next installment of this series.
As expected, Michigan State is projected to be huge favorites in its first two home games against MAC opponents: Western Michigan and Akron. The three games after that (at Washington, versus Minnesota and at Maryland) all project to have MSU favored by roughly a touchdown.
While that sounds positive, the math suggests that the Spartans will most likely go 4-1 in that opening stretch, even if we assume that Michigan State is truly a top-20 caliber team. A 4-1 start would not be the end of the world. In contrast, if the Spartans can go 5-0 to open the season, it will be a very good sign.
Following the road game at Maryland, Michigan State enters a mid-season gauntlet where it plays Ohio State, Wisconsin and at Michigan over a four-week period. The Spartans project to be underdogs against the Buckeyes and Wolverines, and the game with the Badgers looks like a toss-up.
The math for this three-game stretch suggests that the Spartans will most likely go 1-2. Obviously, the home game versus Wisconsin is the most likely win, but the Ohio State game is also at home, and Michigan State always plays Michigan tough, home or away. A record of 2-1 in this stretch is not outlandish, nor is a record of 0-3.
Following the game versus Michigan, the Spartans have drawn three games that all look quite winnable: at Illinois, and home games against Indiana and Rutgers. Michigan State currently projects to be a double-digit favorite in all three games, but the odds of winning all three games is only around 65 percent.
Michigan State closes out the regular season with a near toss-up contest at Penn State. When the final four games of the season are considered together, MSU is most likely to finish 3-1 in the home stretch. Obviously the Penn State game is the most likely loss, but it is very reasonable that the Spartans could defeat the Nittany Lions, but stub their toe in Champaign against Illinois (for example).
In total, the analysis above leads to the conclusion that Michigan State will most likely finish the regular season with a record of 8-4. However, the results of the full-season simulation provide a more accurate account of the Spartans’ possible win distribution. Figure 4 below shows the results of these simulations.
Figure 4: Win total distribution for the 2022 Michigan State football regular season. The solid green bars some the "true" distribution, which takes into account preseason rankings uncertainty. The blue striped bars show the distribution if the preseason rankings are assumed to be correct, which is the case with most analyses done by others.
Figure 4 compares two different sets of data, both of which try to answer the same question: how many games will Michigan State win in 2022? The blue and white striped bars give the results of a calculation that assumes that the preseason rankings are correct. This is essentially the same data that every other website will provide. But, these numbers are not accurate.
The solid green bars represent the results of my simulation of the full season with the known uncertainty of the preseason rankings taken into account. As I have shown previously, this analysis does give accurate results. The overall shape and position of both distributions is essentially the same, but the more accurate green distribution is more broad.
This more precise analysis reveals that the expected win total for the Spartans is 8.32. Interestingly, the math suggests that a nine-win season is the most likely single outcome. The data also suggests that there is a 50-50 chance that Michigan State finishes with between eight and 10 wins total.
My analysis gives the Spartans a 3.6 percent chance to run the table at 12 wins. On the other hand, the math also says that there is an 8.9 percent chance that Michigan State fails to win five games and stays home for the holidays. In these two extreme cases, the Spartans are either quite a bit better or quite a bit worse than the preseason rankings suggest.
While Figure 4 gives an accurate picture of the overall season odds for Michigan State, Figure 3 also suggests that the Spartans will be favored in nine of the team’s 12 total games. This simple analysis agrees with Figure 4 in that the most likely single outcome is for MSU to finish at 9-3.
That said, in my disruptive simulation of the season, the Spartans edge the Buckeyes at home and finish the season at 10-2. As we will see in the next installment of this series, this potential upset could have major implications in the overall Big Ten race.
As for other season odds for the Spartans, my simulation gives Michigan State a 13.2 percent chance to win the Big Ten East, an 8.2 percent chance to win the Big Ten title, a similar 8.1 percent chance to make the College Football Playoff and a 1.8 percent chance to win the national title.
How do these numbers compare to the rest of the Big Ten? That will be the subject of Part Two of this six-part math-based preview. Stay tuned.
