Last Friday I posted my annual Big Ten basketball
preseason math-based analysis. It has been less than a week, but already a lot has happened in the Big Ten race. I basically update and rerun my simulation every few days during the season, but it is not always time efficient to write an entire article.
So, I thought that I would just drop a little bit of data here on the forum. I reran the simulation overnight and here is what it is telling me as of Friday morning. Let's start with the update Big Ten win matrix
 Table 1:
 Updated Big Ten expected wins and win distribution matrix as of Dec. 8, 2023
In this case, I have started to amend the KenPom efficiency margins and expected win totals to show the change since last time (in parenthesis). As we can see, the last seven days were good for Wisconsin (+2.5 win), Illinois (+2), Northwestern (+1.4), Indiana (+2), and Minnesota (+1.6). On the other side of the coin, Purdue (-1 win), Michigan State (-1.5), Nebraska (-2.4), Rutgers (-1.5), and Penn State (-1.4) are moving in the wrong direction.
The number of expected regular season conference wins for Michigan State has dropped from close to 13 to 11.13. In other words, MSU is now projected to finish with an 11-9 conference record. That is currently projected as 5th place behind Purdue, Wisconsin, Illinois, and Ohio State.
As for the odds of winning the Big Ten, the updated data is shown below.
 Table 2:
 Odds to win or share the Big Ten regular season title and the win distributions for those winning teams as of Dec. 8, 2023.
Michigan State's odds to win or share the Big Ten title have also dropped to the 5th best in the conference at just 4%. Notably, the gap between Wisconsin (and Illinois) and Purdue has shrunk. Following the loss to Northwestern, Purdue's odds have dropped to 52% while Wisconsin's odds are up to 27% and Illinois' odds are up to 19%.
I do find it strange that the simulation is still suggesting that a final record of 17-3 (or better) is needed to at least share the Big Ten title in over 60% of the cases. There is currently over an 85% chance that a 16-4 record or better is needed. I will keep an eye out to see how this goes over the next few weeks, but I don't 100% buy this result.
Below I also show the updated Big Ten strengths of schedule.
 Figure 1:
 Big Ten updated overall strengths of schedule as of Dec. 8. The y-axis shows win percentage and the labels show the expected number of wins for a reference team playing each Big Ten schedule.
These data also have shifted slightly in the past week. Michigan State still has one of the easiest schedules in the league, but the difference between MSU in second place and Wisconsin in 10th place is just 0.30 games. Ohio State now grades out with a significantly easier schedule than the rest of the conference. Michigan and Rutgers remain at a significant schedule disadvantage.
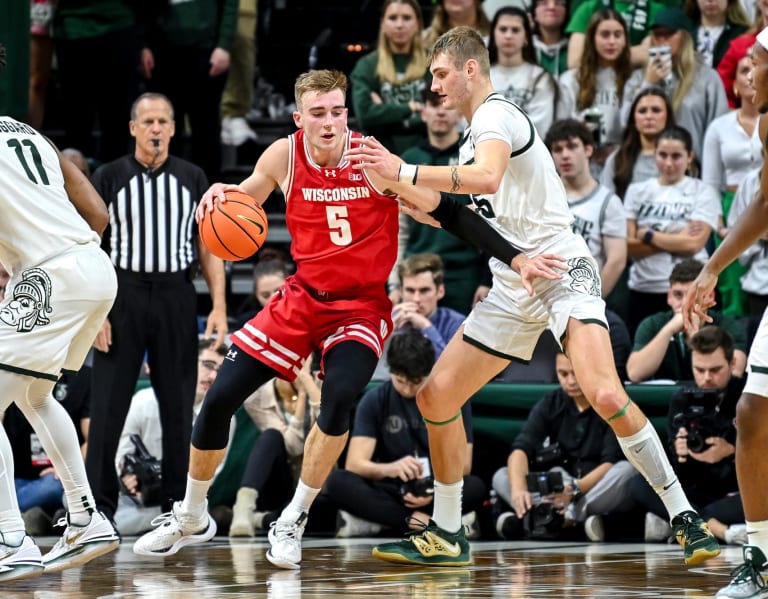
The final piece of data for today is something new for this. The Figure below summarizes the four factors (shooting, turnovers, rebounding, and getting to the free throw line) for MSU's game against Wisconsin.
 Figure 1:
 Summary of Michigan State's performance in the four factors (on both offense and defense) in the loss to Wisconsin on Dec. 5, 2023
Here I show three bars for each offensive and defensive category. The striped bars represent the season average for each team while the solid bars represent the numbers for Tuesday night's game against the Badgers. If a solid bar is green, MSU did well in that category (above average). A yellow bar means a slightly disappointing value and a solid red bar is bad.
A few things are not at all surprising about Figure 1 based on just watching the game. First, rebounding was flat out awful on both ends. MSU was well below their own average while Wisconsin performed above their average on both sides the court. Yuck.
Turnovers were fine and have been all year. MSU is on pace to have the lowest turnover rate in the Izzo era, breaking the record set last year. The Spartan are also creating turnovers at an above average clip. Those numbers were fine on Tuesday.
The effective field goal numbers are slightly surprising. Wisconsin shot just under 55% in adjusted field goal percentage. That is way too high. But, despite the cold start, MSU's effective field goal percent of 51% is not that bad and even above average for the year. (but still a tad lower than an average Izzo-coached team). That surprised me a bit.
Finally, there is free throw rate. I complained a bit about the officials, and this data perhaps backs up my complaints a little. In general, the officials did not call many fouls on either team. Wisconsin's free throw rate was well below their average. But look at the MSU free throw rate on offense. It is less than half of MSU typical rate for the year. Furthermore, it is not as if Wisconsin is known for not fouling this year. The Badgers rank No. 211 in free throw rate on defense. Yet on Tuesday, MSU barely found the free throw line in a home game. That is just weird.
As a final note, I also will track throughout the year the teams which have a typical offensive and defensive efficiency to be considered National Title contenders. This week there are 14 teams on that list. MSU has played or will play five of those 14 teams (Arizona, Illinois, Wisconsin, Tennessee, and Purdue).
That is all for now. Hopefully MSU can get the win in Lincoln this weekend and we can start to see these numbers moving in a positive direction. One thing to remember is that this entire analysis assumes that the version of Michigan State that we have seen so far is "who they are" on average. There is a solid chance that MSU gets better, but there is an
equal chance that MSU gets worse. That is how this analysis is set up. Personally, I feel like so far this team has played much closer to their floor than to their ceiling. If my hypothesis is correct, we should expect to see the numbers improve over the coming months and for the Spartans to start moving back up towards the top of these tables.

 michiganstate.rivals.com


