Colleges
- American Athletic
- Atlantic Coast
- Big 12
- Big East
- Big Ten
- Colonial
- Conference USA
- Independents (FBS)
- Junior College
- Mountain West
- Northeast
- Pac-12
- Patriot League
- Pioneer League
- Southeastern
- Sun Belt
- Army
- Charlotte
- East Carolina
- Florida Atlantic
- Memphis
- Navy
- North Texas
- Rice
- South Florida
- Temple
- Tulane
- Tulsa
- UAB
- UTSA
- Boston College
- California
- Clemson
- Duke
- Florida State
- Georgia Tech
- Louisville
- Miami (FL)
- North Carolina
- North Carolina State
- Pittsburgh
- Southern Methodist
- Stanford
- Syracuse
- Virginia
- Virginia Tech
- Wake Forest
- Arizona
- Arizona State
- Baylor
- Brigham Young
- Cincinnati
- Colorado
- Houston
- Iowa State
- Kansas
- Kansas State
- Oklahoma State
- TCU
- Texas Tech
- UCF
- Utah
- West Virginia
- Illinois
- Indiana
- Iowa
- Maryland
- Michigan
- Michigan State
- Minnesota
- Nebraska
- Northwestern
- Ohio State
- Oregon
- Penn State
- Purdue
- Rutgers
- UCLA
- USC
- Washington
- Wisconsin
High Schools
- Illinois HS Sports
- Indiana HS Sports
- Iowa HS Sports
- Kansas HS Sports
- Michigan HS Sports
- Minnesota HS Sports
- Missouri HS Sports
- Nebraska HS Sports
- Oklahoma HS Sports
- Texas HS Hoops
- Texas HS Sports
- Wisconsin HS Sports
- Cincinnati HS Sports
- Delaware
- Maryland HS Sports
- New Jersey HS Hoops
- New Jersey HS Sports
- NYC HS Hoops
- Ohio HS Sports
- Pennsylvania HS Sports
- Virginia HS Sports
- West Virginia HS Sports
ADVERTISEMENT
You are using an out of date browser. It may not display this or other websites correctly.
You should upgrade or use an alternative browser.
You should upgrade or use an alternative browser.
Filters
Show only:
MEN'S BASKETBALL Dr. G&W's NCAA Tournament Performance Metrics: Keeping PASE
- Spartans Illustrated Message Board
- 1 Replies
The 2021 Men’s NCAA Basketball Tournament is now over, and the Baylor Bears are your 2021 champions. With the 2021 season now officially complete, it is time to look back and reflect on the year that was. The subject for today is one that has always fascinated me: how to quantify the performance of coaches and teams in the NCAA Tournament.
That said, not all paths in the NCAA Tournament are equal, and therefore making comparisons based on these raw metrics does not provide a complete picture. In fact, the structure of the tournament is specifically designed to give the better teams the easiest possible paths to the Final Four. Is there a way to normalize this performance and put teams on a more level playing field?
One metric that attempts to do this is called Performance Against Seed Expectation or “PASE.” This metric dates back to at least 2008 and is straight-forward to calculate. It is designed to measure the number of games that a team or coach wins in each tournament relative to the average number of games that a team with the same seed has won historically.
For example, No. 1 seeds since 1985 are 484-121 at-time in the NCAA Tournament. There have been a total of 36 tournaments played since 1985, each with four No. 1 seeds. So, this means that No. 1 seeds historically win 3.36 games per tournament (484 divided by 36 and then divided by four).
In 2021, Baylor won six total games, or 2.64 game more than an average No. 1 seed. Therefore, Baylor’s PASE in 2021 was +2.64. Gonzaga won only five games, or 1.64 more than average for a PASE of +1.64. Michigan won only three games, or 0.36 less than average for a PASE of -0.36, while Illinois won only one game to finish with a PASE of -2.36.
This same calculation can be performed on the No. 2 seed (who on average win 2.35 games per tournament), No. 3 seeds (who win 1.85 games per tournament), and so on down to the No. 16 seeds who win only 0.01 games per tournament, not counting the more recent play-in games.
The PASE metric can be calculated based on either team or coach. Figure 1 below shows the current top-15 teams and coaches going back to 1979.

Figure 1: Performance against seed expectation (PASE) for the top 15 teams (left) and coaches (right) from 1979-2021
As we can see Michigan State and Tom Izzo both score very highly in both metrics. Over a 40-year span, MSU ranks fourth overall in PASE (behind only Louisville, Kentucky, and North Carolina), having won over 14 tournament games more than expected based on the historical averages. I should also note that those calculations also do not discount vacated tournament wins for teams who have been caught cheating, such as Louisville or our friend down in Ann Arbor.
Coach Izzo does even better. As Figure 1 indicates, Tom Izzo’s current PASE score of +13.51 is currently No. 1 out of all 649 coaches to have appeared in the NCAA Tournament since 1979. This score is actually down from the value of +15.24 following the 2019 tournament and Coach Izzo’s score of +16.38 following the 2015 tournament, which is the highest score of any coach ever.
Simply having a score over +12 is a very significant accomplishment. Based on my records, only three other coaches in history have ever achieved a score that high: Mike Krzyewski of Duke (who peaked in 2001 and has been in decline, on average, ever since), Denny Crum from Louisville, and Rick Pitino also of Louisville (and currently at Iona).
For example, Michigan State was a No. 11 seed in 2021. Most No. 11 seed will play a No. 6 seed in the first round, but as a participant in the First Four, MSU instead played No. 11 UCLA. Basically, in the current tournament format, not all No. 11 seeds take the same path, and this causes inconsistencies in the PASE calculation.
Fortunately, I have developed additional metrics that do not have these limitations. Back in 2015, before I had heard of PASE, I created two new metrics that attempt to do almost the same thing. However, I approached the problem slightly differently.
The first metric I now call PARIS (for Performance Against Round-Independent Seed). Mathematically, PARIS is very similar to PASE, but it compares a team’s performance in each individual game instead of in each set of games that make up one tournament run. I perform the same calculation of actual wins versus expected wins, except that the comparison is made based on each seeds performance, round-by-round.
To again return to the example of the No. 1 seeds in 2021, these seeds historically win 99.3 percent of first round games, 85 percent of second round games, 80 percent of third round games, and then roughly 60 percent of games in round four, five, and six.
For Illinois in 2021, the Fighting Illini won their first round game and lost in their second round game. In those two games, a No. 1 seed is expected to win 1.84 of those game (0.993 plus 0.850), but since Illinois only won one game, the Illini’s PARIS score for 2021 is -0.84 (1.00 minus 1.84).
For Michigan, in the four games that the Wolverines played, the expected win total for a No. 1 seed is 3.24 (0.993 plus 0.850 plus 0.796 plus 0.602). As the Wolverines only won three games, their 2021 PARIS score is -0.24 (3.00 minus 3.24).
As you would expect, PARIS and PASE and strongly correlated, but do differ slightly. PASE tends to reward teams more for long tournament runs and punish teams more for losing early. A team like Illinois is punished for games that it never even had a chance to play (like a Sweet 16 game).
But, PARIS is more flexible in the way that it can handle play-in games and byes. Each game and round is handled independently, so the structure of the tournament doesn’t matter as much. In addition, the sum of PARIS for all teams and coaches over all years is equal to zero, meaning that it is truly a measure of above (positive) or below (negative) average performance.
Tom Izzo is also currently first of all coaches in the PARIS metric with a score of +8.39, while Michigan State overall moves up into second place all-time in PARIS, with a score of +9.15.
Michigan State fans are familiar with this effect as well. MSU has made the Final Four taking both a fairly tough route (for example in 2000, 2009, and 2019) but also a fairly easy route (in 2001 and 2010).
In order to try to account for these differences, it occurred to me that it is possible to make a more specific calculation of the historical odds for the top seed to win in any given seed combination. For example, when a No. 3 seed plays a No. 6 seed in the second round, the No. 3 seed wins 57.6 percent of the time. However, when the No. 3 seed plays a No. 11 seed, the top seed wins 67.8 percent of the time.
No. 3 seeds therefore should get more “credit” when they beat No. 6 seeds and they should be punished more if they lose to a No. 11 seeds. I created the Performance Against exact seed Differential or “PAD,” to account for this effect using the expected values derived using this methodology.
Interestingly, not only does Izzo also lead all coaches with the highest PAD (+7.97), but Michigan State University also has the highest PAD (+8.77) of all 352 Division One teams back to 1979.
While the individual PARIS and PAD scores are interesting, we can learn something new by comparing the results from each calculation. The PAD metric was designed to correct for the fact that some teams get easier draws than others due to upsets elsewhere in the bracket. So, if a team or coach has a higher PARIS score than PAD score, that team or coach on average has received an easier than expected NCAA Tournament path relative to all other teams.
The opposite is also true, as a PAD score that is higher than a PARIS score implies that team or coach has on average traversed a more difficult NCAA Tournament path. In other words, subtracting the PAD score from the PARIS provides a measure of the amount of “luck” that a team or coach has had in NCAA Tournament draws relative to all other teams and coaches.
With all that said, let’s look at some more data. Figure 2 compares this new “luck” metric (PARIS minus PAD) to just the PAD metric for all 649 coaches who have appeared in the NCAA Tournament.

Figure 2: Comparison of the luck for each NCAA Tournament coach relative to their performance relative to expectation
This figure tells us almost everything we need to know about NCAA Tournament performance relative to seed expectation. The vast majority of coaches are simply clustered near the center of the graph. But, several notable coaches form a halo around this center.
These outliers can be grouped into four categories based on how lucky they have been (the y-axis, PARIS minus PAD) and how well they have done overall, relative to their seed (the x-axis, PAD).
From the Figure we can once again see that Izzo is really, really good in March and also slightly lucky, but by less than half of a game. The only two coaches that approach Izzo’s PAD score are the 20th century legends Denny Crum (Louisville) and the very unlucky Rollie Massimino (Villanova).
As for Coach Izzo’s contemporaries, we can see that Rick Pitino and John Calipari have had luck similar to Izzo. Jim Boeheim, John Beilein, Jim Calhoun, and Coach K are all very good, but they all also have won at least a game more than they should have just due to schedule luck in March.
No coach in NCAA Tournament history has been luckier than Billy Donovan, who benefited from a No. 2 seed losing to a No. 15 seed in his half of the bracket not once, but twice, in 2012 and 2013. On the flip side, recently retired Kansas and North Carolina coach Roy Williams has been the least lucky successful coach. Gary Williams and Lute Olson were also both fairly unlucky on balance.
Figure 2 also gives a sample of some of the coaches who have notably underachieved relative to their seed. Bill Self, Bob Huggins, Kelvin Sampson, and Tony Bennett all have negative PAD scores, but this analysis suggests that all four coaches have actually been more lucky than average in their tournament draws. It actually could have been worse.
This Figure also highlights the coach that has underachieved the most overall in the history of the tournament: Rick Barnes, previously of Texas and now at Tennessee. The math suggests that he should have over six more tournament wins that he actually has, based on the draws that he has been given over time. Gene Keady (PAD of -4.23) and Fran Dumphry (-4.18) both should send Rick a nice Christmas card each year.
A “Performance against Vegas expectation” (PAVE) metric would achieve just this goal, and if I had all of that data back to 1979, I would certainly calculate it. Unfortunately, getting a complete set of that data is difficult, and I simply do not have it.
Fortunately, there is a way to estimate Vegas lines and win probabilities using Kenpom efficiency data. While this data is only reliable back to 2002, it does provide a solid 19 years of data to crunch in order to create a “Performance Against Kenpom Efficiency” or PAKE metric, as others have referred to it previously. Figure 3 below compares the PAD metric as calculated only back to 2002 to the PAKE metric in the same timeframe.

Figure 3: Comparison of the PAD and PAKE metrics back to 2002
As we can see, PAD and PAKE are highly correlated, but there are a few notable data points that do deviate from the best fit-line, and Coach Izzo is one of them. Izzo’s PAD since 2002 is still the best of all coaches, but his PAKE is a bit lower and only fifth overall, behind Jim Boeheim, Roy Williams, John Calipari, and John Beilein.
My interpretation of this effect is that it relates to the accuracy of the seeding done by the committee, on average. Based on the relative seeds of teams in Coach Izzo’s path since 2002, Michigan State has won six more tournament games than expected.
But, the Kenpom efficiency projected point spreads suggest that this number is a little high. Based on Kenpom (a more accurate estimate of relative team strengths), Michigan State has actually only won about four-and-a-half more games than expected. This can mean only one of two things. Either MSU’s opponents, on average, were given better seeds than they deserved (which is unlikely, as this is almost certainly random) or MSU, on average, has been given a worse seed than it deserves.
If my interpretation is correct, Coach Izzo has been the most under-seeded coach in the modern history of the tournament, and it is not close. While most other coaches fall very close to the trend-line, a few also standout as being consistently given a better seed than they deserve. Most notable is this group is Jim Beoheim, Roy Williams, and especially Bill Self.
While that completes this particular dive in the data of the NCAA Tournament, in the coming days and weeks I will be continuing to dig through the numbers, looking for interesting stories to tell. Stay tuned and Go Green.
PASE Yourself
There are dozens are different ways to measure performance in March. The most obvious ones include stats like total wins, overall win percentages, Final Fours, and national titles. The Spartans and head coach Tom Izzo are in the top-10 in all four of these categories in the modern era (which I define as from 1979 on, which was the first year the teams were seeded and that the tournament expanded to beyond 32 teams).That said, not all paths in the NCAA Tournament are equal, and therefore making comparisons based on these raw metrics does not provide a complete picture. In fact, the structure of the tournament is specifically designed to give the better teams the easiest possible paths to the Final Four. Is there a way to normalize this performance and put teams on a more level playing field?
One metric that attempts to do this is called Performance Against Seed Expectation or “PASE.” This metric dates back to at least 2008 and is straight-forward to calculate. It is designed to measure the number of games that a team or coach wins in each tournament relative to the average number of games that a team with the same seed has won historically.
For example, No. 1 seeds since 1985 are 484-121 at-time in the NCAA Tournament. There have been a total of 36 tournaments played since 1985, each with four No. 1 seeds. So, this means that No. 1 seeds historically win 3.36 games per tournament (484 divided by 36 and then divided by four).
In 2021, Baylor won six total games, or 2.64 game more than an average No. 1 seed. Therefore, Baylor’s PASE in 2021 was +2.64. Gonzaga won only five games, or 1.64 more than average for a PASE of +1.64. Michigan won only three games, or 0.36 less than average for a PASE of -0.36, while Illinois won only one game to finish with a PASE of -2.36.
This same calculation can be performed on the No. 2 seed (who on average win 2.35 games per tournament), No. 3 seeds (who win 1.85 games per tournament), and so on down to the No. 16 seeds who win only 0.01 games per tournament, not counting the more recent play-in games.
The PASE metric can be calculated based on either team or coach. Figure 1 below shows the current top-15 teams and coaches going back to 1979.

Figure 1: Performance against seed expectation (PASE) for the top 15 teams (left) and coaches (right) from 1979-2021
As we can see Michigan State and Tom Izzo both score very highly in both metrics. Over a 40-year span, MSU ranks fourth overall in PASE (behind only Louisville, Kentucky, and North Carolina), having won over 14 tournament games more than expected based on the historical averages. I should also note that those calculations also do not discount vacated tournament wins for teams who have been caught cheating, such as Louisville or our friend down in Ann Arbor.
Coach Izzo does even better. As Figure 1 indicates, Tom Izzo’s current PASE score of +13.51 is currently No. 1 out of all 649 coaches to have appeared in the NCAA Tournament since 1979. This score is actually down from the value of +15.24 following the 2019 tournament and Coach Izzo’s score of +16.38 following the 2015 tournament, which is the highest score of any coach ever.
Simply having a score over +12 is a very significant accomplishment. Based on my records, only three other coaches in history have ever achieved a score that high: Mike Krzyewski of Duke (who peaked in 2001 and has been in decline, on average, ever since), Denny Crum from Louisville, and Rick Pitino also of Louisville (and currently at Iona).
A trip to PARIS
While PASE is a useful and well established metric, it does have its flaws and limitations. It works very well in the years when the tournament included 64 or 65 teams (from 1985 to 2010), but for the timeframes before and after that, things get messy.For example, Michigan State was a No. 11 seed in 2021. Most No. 11 seed will play a No. 6 seed in the first round, but as a participant in the First Four, MSU instead played No. 11 UCLA. Basically, in the current tournament format, not all No. 11 seeds take the same path, and this causes inconsistencies in the PASE calculation.
Fortunately, I have developed additional metrics that do not have these limitations. Back in 2015, before I had heard of PASE, I created two new metrics that attempt to do almost the same thing. However, I approached the problem slightly differently.
The first metric I now call PARIS (for Performance Against Round-Independent Seed). Mathematically, PARIS is very similar to PASE, but it compares a team’s performance in each individual game instead of in each set of games that make up one tournament run. I perform the same calculation of actual wins versus expected wins, except that the comparison is made based on each seeds performance, round-by-round.
To again return to the example of the No. 1 seeds in 2021, these seeds historically win 99.3 percent of first round games, 85 percent of second round games, 80 percent of third round games, and then roughly 60 percent of games in round four, five, and six.
For Illinois in 2021, the Fighting Illini won their first round game and lost in their second round game. In those two games, a No. 1 seed is expected to win 1.84 of those game (0.993 plus 0.850), but since Illinois only won one game, the Illini’s PARIS score for 2021 is -0.84 (1.00 minus 1.84).
For Michigan, in the four games that the Wolverines played, the expected win total for a No. 1 seed is 3.24 (0.993 plus 0.850 plus 0.796 plus 0.602). As the Wolverines only won three games, their 2021 PARIS score is -0.24 (3.00 minus 3.24).
As you would expect, PARIS and PASE and strongly correlated, but do differ slightly. PASE tends to reward teams more for long tournament runs and punish teams more for losing early. A team like Illinois is punished for games that it never even had a chance to play (like a Sweet 16 game).
But, PARIS is more flexible in the way that it can handle play-in games and byes. Each game and round is handled independently, so the structure of the tournament doesn’t matter as much. In addition, the sum of PARIS for all teams and coaches over all years is equal to zero, meaning that it is truly a measure of above (positive) or below (negative) average performance.
Tom Izzo is also currently first of all coaches in the PARIS metric with a score of +8.39, while Michigan State overall moves up into second place all-time in PARIS, with a score of +9.15.
PADing the Stats
As I was developing the PARIS metric, it occurred to me that while comparing teams based on performance per round has some value, not all paths in the NCAA Tournament are equal, even for the same seeds. In 2021, for example, Baylor reached the Final Four by defeating a No. 16, No. 9, No. 5, and No. 3 seed, while its national semifinal opponent, No. 2 Houston faced a No. 15, No. 10, No. 11, and No. 12 seed. Clearly, Baylor faced a tougher path.Michigan State fans are familiar with this effect as well. MSU has made the Final Four taking both a fairly tough route (for example in 2000, 2009, and 2019) but also a fairly easy route (in 2001 and 2010).
In order to try to account for these differences, it occurred to me that it is possible to make a more specific calculation of the historical odds for the top seed to win in any given seed combination. For example, when a No. 3 seed plays a No. 6 seed in the second round, the No. 3 seed wins 57.6 percent of the time. However, when the No. 3 seed plays a No. 11 seed, the top seed wins 67.8 percent of the time.
No. 3 seeds therefore should get more “credit” when they beat No. 6 seeds and they should be punished more if they lose to a No. 11 seeds. I created the Performance Against exact seed Differential or “PAD,” to account for this effect using the expected values derived using this methodology.
Interestingly, not only does Izzo also lead all coaches with the highest PAD (+7.97), but Michigan State University also has the highest PAD (+8.77) of all 352 Division One teams back to 1979.
While the individual PARIS and PAD scores are interesting, we can learn something new by comparing the results from each calculation. The PAD metric was designed to correct for the fact that some teams get easier draws than others due to upsets elsewhere in the bracket. So, if a team or coach has a higher PARIS score than PAD score, that team or coach on average has received an easier than expected NCAA Tournament path relative to all other teams.
The opposite is also true, as a PAD score that is higher than a PARIS score implies that team or coach has on average traversed a more difficult NCAA Tournament path. In other words, subtracting the PAD score from the PARIS provides a measure of the amount of “luck” that a team or coach has had in NCAA Tournament draws relative to all other teams and coaches.
With all that said, let’s look at some more data. Figure 2 compares this new “luck” metric (PARIS minus PAD) to just the PAD metric for all 649 coaches who have appeared in the NCAA Tournament.

Figure 2: Comparison of the luck for each NCAA Tournament coach relative to their performance relative to expectation
This figure tells us almost everything we need to know about NCAA Tournament performance relative to seed expectation. The vast majority of coaches are simply clustered near the center of the graph. But, several notable coaches form a halo around this center.
These outliers can be grouped into four categories based on how lucky they have been (the y-axis, PARIS minus PAD) and how well they have done overall, relative to their seed (the x-axis, PAD).
From the Figure we can once again see that Izzo is really, really good in March and also slightly lucky, but by less than half of a game. The only two coaches that approach Izzo’s PAD score are the 20th century legends Denny Crum (Louisville) and the very unlucky Rollie Massimino (Villanova).
As for Coach Izzo’s contemporaries, we can see that Rick Pitino and John Calipari have had luck similar to Izzo. Jim Boeheim, John Beilein, Jim Calhoun, and Coach K are all very good, but they all also have won at least a game more than they should have just due to schedule luck in March.
No coach in NCAA Tournament history has been luckier than Billy Donovan, who benefited from a No. 2 seed losing to a No. 15 seed in his half of the bracket not once, but twice, in 2012 and 2013. On the flip side, recently retired Kansas and North Carolina coach Roy Williams has been the least lucky successful coach. Gary Williams and Lute Olson were also both fairly unlucky on balance.
Figure 2 also gives a sample of some of the coaches who have notably underachieved relative to their seed. Bill Self, Bob Huggins, Kelvin Sampson, and Tony Bennett all have negative PAD scores, but this analysis suggests that all four coaches have actually been more lucky than average in their tournament draws. It actually could have been worse.
This Figure also highlights the coach that has underachieved the most overall in the history of the tournament: Rick Barnes, previously of Texas and now at Tennessee. The math suggests that he should have over six more tournament wins that he actually has, based on the draws that he has been given over time. Gene Keady (PAD of -4.23) and Fran Dumphry (-4.18) both should send Rick a nice Christmas card each year.
PAKE My Day
All of the analysis shown above is based one way or another on the seed of each team. They all assume that teams with the same seed are all equal, which is also not true. In order to get the most accurate measure of a team’s or coach’s NCAA Tournament performance relative to expectation, it would best to simply use the win probability for all tournament games based on the Vegas betting line.A “Performance against Vegas expectation” (PAVE) metric would achieve just this goal, and if I had all of that data back to 1979, I would certainly calculate it. Unfortunately, getting a complete set of that data is difficult, and I simply do not have it.
Fortunately, there is a way to estimate Vegas lines and win probabilities using Kenpom efficiency data. While this data is only reliable back to 2002, it does provide a solid 19 years of data to crunch in order to create a “Performance Against Kenpom Efficiency” or PAKE metric, as others have referred to it previously. Figure 3 below compares the PAD metric as calculated only back to 2002 to the PAKE metric in the same timeframe.

Figure 3: Comparison of the PAD and PAKE metrics back to 2002
As we can see, PAD and PAKE are highly correlated, but there are a few notable data points that do deviate from the best fit-line, and Coach Izzo is one of them. Izzo’s PAD since 2002 is still the best of all coaches, but his PAKE is a bit lower and only fifth overall, behind Jim Boeheim, Roy Williams, John Calipari, and John Beilein.
My interpretation of this effect is that it relates to the accuracy of the seeding done by the committee, on average. Based on the relative seeds of teams in Coach Izzo’s path since 2002, Michigan State has won six more tournament games than expected.
But, the Kenpom efficiency projected point spreads suggest that this number is a little high. Based on Kenpom (a more accurate estimate of relative team strengths), Michigan State has actually only won about four-and-a-half more games than expected. This can mean only one of two things. Either MSU’s opponents, on average, were given better seeds than they deserved (which is unlikely, as this is almost certainly random) or MSU, on average, has been given a worse seed than it deserves.
If my interpretation is correct, Coach Izzo has been the most under-seeded coach in the modern history of the tournament, and it is not close. While most other coaches fall very close to the trend-line, a few also standout as being consistently given a better seed than they deserve. Most notable is this group is Jim Beoheim, Roy Williams, and especially Bill Self.
While that completes this particular dive in the data of the NCAA Tournament, in the coming days and weeks I will be continuing to dig through the numbers, looking for interesting stories to tell. Stay tuned and Go Green.
HOCKEY Wings trade deadline
- Spartans Illustrated Message Board
- 4 Replies
I don’t care if it’s a bag of pucks and a mid to late round pick but move anyone you can, Ryan, LG, Bernier, Nemeth, Stahl, etc. retain salary if you have to. All free agents to be.
OTHER SCHOOLS: Another UM decommit
- Spartans Illustrated Message Board
- 46 Replies
4 and counting for 2022. Hearing parents getting nervous with Jimmy’s job security
Fitzpatrick up to 240 lbs
- By michimanst8
- Spartans Illustrated Message Board
- 43 Replies
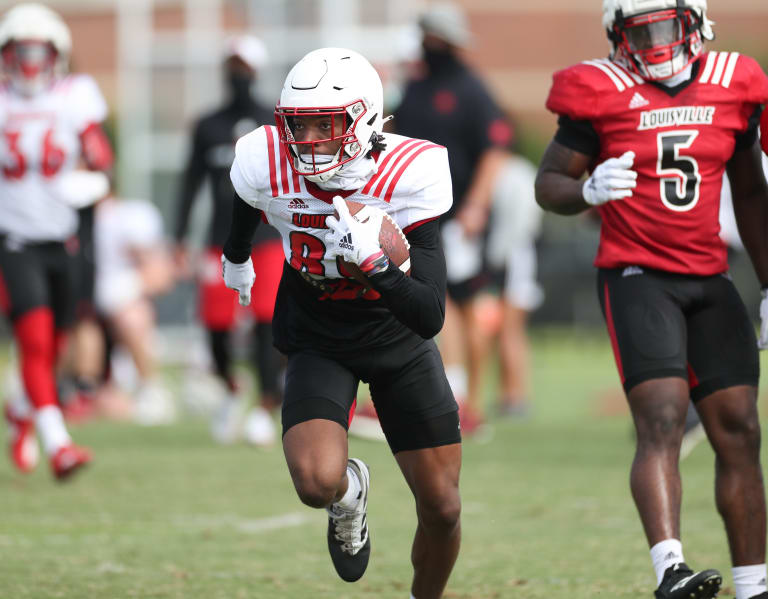
Anyone catch Farrell's article on Fitzpatrick in which he notes he's up to 240 lbs now and could be used as a TE?
 n.rivals.com

Rivals.com: Rivals Football & Basketball Recruiting - Transfer Tracker: Michigan State adds another from portal
Michigan State remained busy in the transfer portal on Saturday by adding Louisville WR Christian Fitzpatrick
Thorne embracing QB competition, focused on self improvement (link)
- Spartans Illustrated Message Board
- 5 Replies
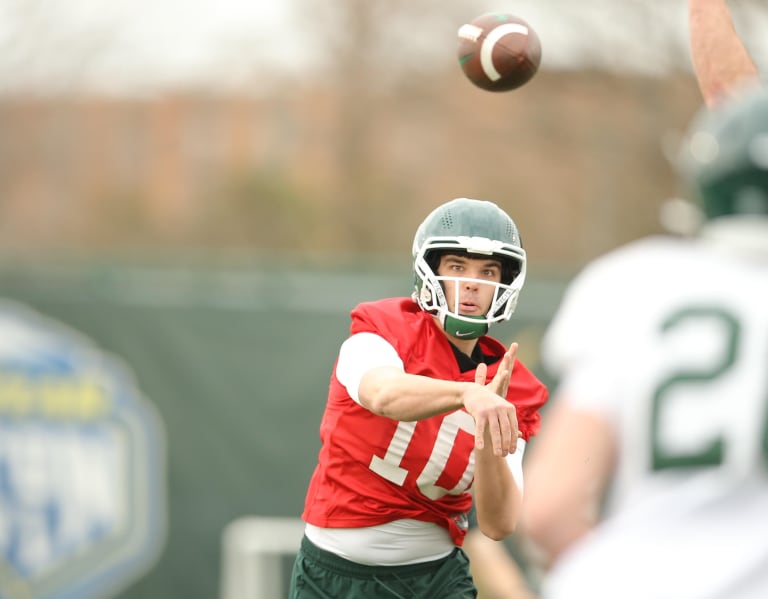
Rico C did a really nice job with this story on Payton Thorne and the QB competion. Couple of notes worth mentioning. I think it is interesting that Thorne said that they have simplified the offense a little bit. I also think its interesting that Thorne is feeling better about running the football with the off-season strength gains.
 michiganstate.rivals.com

Thorne embracing QB competition, focused on self improvement
Payton Thorne has made the most of his experience in 2020 as he competes for starting quarterback job.
Laughery pleasantly surprised by Michigan State offer (link)
- Spartans Illustrated Message Board
- 0 Replies
Kenny Jordan caught up with Illinois athlete Aidan Laughery who was offered by Michigan State earlier this week.
Laughery, who has offers from Illinois, Minnesota, and Rutgers among Big Ten schools, wasn't expecting a Spartan offer.
Good stuff from Kenny Jordan. Thanks Kenny.

 michiganstate.rivals.com
Laughery, who has offers from Illinois, Minnesota, and Rutgers among Big Ten schools, wasn't expecting a Spartan offer.
Good stuff from Kenny Jordan. Thanks Kenny.

Michigan State offer catches Illinois athlete by surprise
Illinois athlete Aidan Laughery (2022) was surprised and excited to get a Michigan State offer earlier this week.
Popeye Williams locking in visits to each of his finalists (link)
- Spartans Illustrated Message Board
- 6 Replies
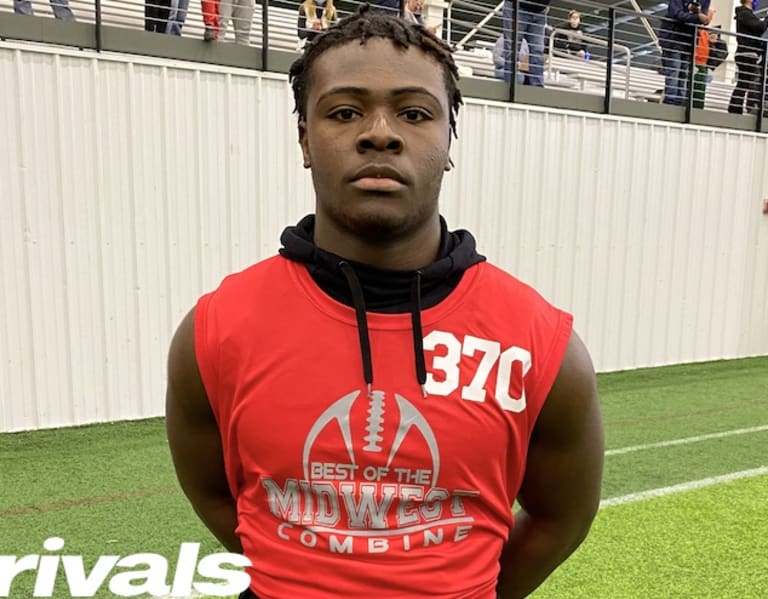
Jason caught up with Popeye Williams who broke down each of his finalists as well as his plans for official visits. Good stuff from Jason.
Williams is an interesting prospect. I know for a fact that Ron Burton likes him.
 michiganstate.rivals.com
Williams is an interesting prospect. I know for a fact that Ron Burton likes him.

Popeye Williams locking in visits to each of his finalists
DE Popeye Williams is looking to visit Michigan State and his other finalists before choosing a college.
HOCKEY Lewandowski is back
- By MSUStudent
- Spartans Illustrated Message Board
- 5 Replies
Johnson sees offense taking 'huge strides' this spring (link)
- Spartans Illustrated Message Board
- 0 Replies
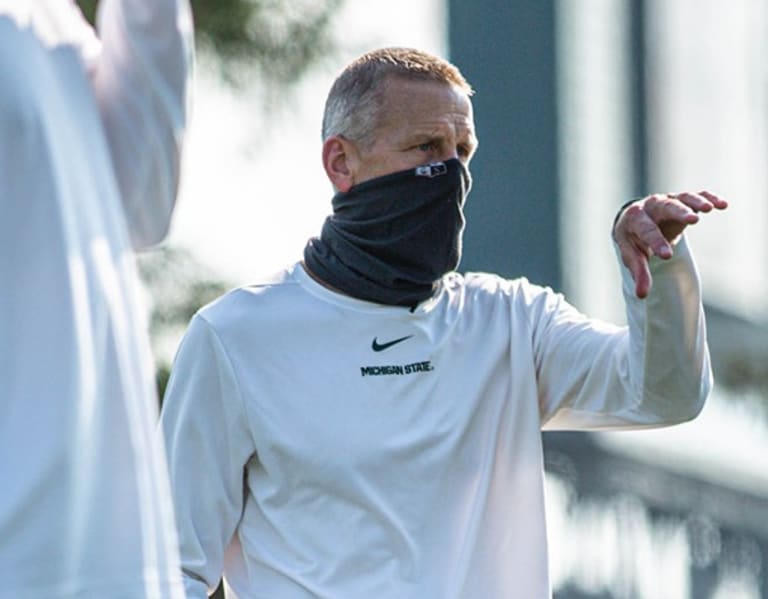
Here is my notebook from Jay Johnson's Zoom call this afternoon.
Johnson had some good things to say about both Russo, Thorne.
He also indicated that he really likes what Michigan State has coming back at WR.
 michiganstate.rivals.com
Johnson had some good things to say about both Russo, Thorne.
He also indicated that he really likes what Michigan State has coming back at WR.

Johnson seeing 'huge strides' from MSU offense this spring
O-coordinator Jay Johnson weighed on on quarterback competition, growth of MSU offense after practice Monday.
Russo getting comfortable, gaining confidence in MSU offense (link)
- Spartans Illustrated Message Board
- 0 Replies
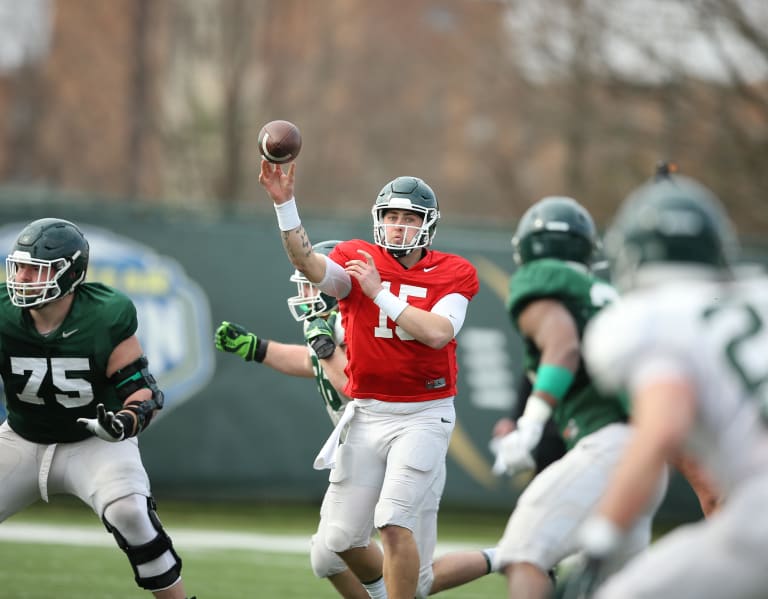
Here is an article I put together on Anthony Russo (link)
Rico C. is doing an article on Payton Thorne that will be out later tonight or tomorrow.
I will put Thorne's Zoom call on the message board shortly.
 michiganstate.rivals.com
Rico C. is doing an article on Payton Thorne that will be out later tonight or tomorrow.
I will put Thorne's Zoom call on the message board shortly.

Spartans Illustrated - Russo getting comfortable, gaining confidence at QB
Grad transfer QB Anthony Russo is showing out as he gains a working knowledge of MSU offense.
MEN'S BASKETBALL Big Picture MSU vs. UofM Musings...
- Spartans Illustrated Message Board
- 10 Replies
As I was watching UofM play in the Regional Final game last Tuesday, I had a lot of thought about the status and history of the MSU - UofM rivalry. Obviously, UofM had a great season, but (as always) it seemed like they were getting a bit too much credit for some of their accomplishments. For example, most of us likely saw the tweet / stat about who UofM had the most tournament wins of any program back to 2013. The tweet that I saw then took the additional step connecting the dots to say that Michigan was, therefore, a "blue-blood..." Um, OK.
While that stat itself is true and certainly a great accomplishment, it is also true that a disproportionate number of those wins since 2013 came against lower seeded teams. In fact, prior to their win over No. 4 Florida State, Michigan had beat only one team seeded better than a No. 6 going back to 2014 (No. 2 Louisville in 2017). MSU had more highly quality Tournament wins in one weekend in 2019 than Michigan had in over seven years. And, then us not forget that if Kansas or Houston makes one more clutch free throw and/or Michigan doesn't hit a late 30-foot shot, the Wolverines have no Final Fours this century.
Fans on both sides can, have, and will continue to cherry pick stats that fit their narrative. All data tells a story.
Whether it is basketball or football, the play book for Michigan is always the same. When the Wolverines cycle up, this is the beginning of a new phase of dominance for Big Blue where they will wrack up Big Ten and National Titles on an rate that no one has every seen. When they have a down year, it is only temporary. Next year, they will return to glory. As for MSU, any success that the Spartan have in minimized in Ann Arbor. Yes, Tom Izzo has eight Final Fours, all at one school (good for 2nd all time in the modern, post-1979 era) but he has only played in two title games. Yes, Tom Izzo has the most upset wins in the history of the Tournament, but he has lost to a double digit seed three times since 2016. Yes, Tom Izzo is poised to break Bobby Knight's all-time Big Ten win record if he coaches 2-3 more years, but he is clearly past him prime.
The bar for MSU is placed impossibly high, while the bar for Michigan is placed just inches off of the floor... and most years they still can't clear it.
For the very big picture standpoint, Michigan is considered a football "blue blood" over the past 50 years, while MSU is considered to be a basketball powerhouse over the past 25, at least. So, it perhaps makes sense to compare MSU's success in football to UofM's success in basketball and vice versa. From this point of view, I had the following thought.
Michigan's current run in basketball (from 2013 to now) is more or less comparable to Mark Dantonio's run in football from 2010 to 2015. What if we compare them more directly?
In the past 25 years, MSU basketball has 10 Big Ten Regular season titles, 8 Final Fours, and 6 Big Ten tournament titles. Just in the past 10 years, MSU basketball has 4 Big Ten Regular season titles, 2 Final Fours, and 4 Big Ten tournament titles.
What if we compare this to the accomplishments of Michigan Football in the same time period when MSU had cycled up in football? It is hard to make a direct comparison of the two sports, but I would argue that a basketball Final Four is roughly equivalent to either making the Football playoffs or winning a NY6/BCS game such as the Rose Bowl. In the 10 years prior to 2015, what had Michigan accomplished in football? The record shows ZERO Big Ten titles and only 3 Bowl wins, only one of which (the 2011 Sugar Bowl) was BCS-level. If you extend the timeframe back 25 years prior to 2015, it is not quite as bad for Big Blue, they have 7 Big Ten titles and 4 notable Bowl wins, including two Rose Bowl wins in the 1990s.
The comparison is clear. MSU basketball has achieved more than UofM football has over the past 10, 25, or 50 years while MSU football has achieved more than UofM basketball over similar time horizons. But, the folks in Ann Arbor would likely argue to the death that this is not true. But, imagine a situation where in the past 10 years MSU basketball had zero Big Ten titles and only one Final Four. If Michigan were to cycle up in basketball to win just a single Big Ten title and make an elite eight, they would be claim that MSU-UofM is no longer even a rivalry, and that MSU basketball was doomed. Why isn't the narrative for Michigan football the same?
Anyway, these are just my random thought for today...
Introducing our new Recruiting Intern, Noah Sprunger!
- Spartans Illustrated Message Board
- 41 Replies
Maggers,
I'm pleased to announce that we are bringing Noah Sprunger aboard on an official basis as our newest recruiting reporter intern.
Many of you have gotten to know him here on The Underground Bunker as "rivalsnoah." In a short time, he has gained quite a following at SpartanMag.com and has shown great news judgement and industriousness in adding to the recruiting narrative at our web site. He is now ready to being working on an official basis for SpartanMag.com as a recruiting reporter.
I had a great, lively conversation with Noah last night and I am looking forward to working with him as we move forward. Noah, Jason Killop and Kenny Jordan all have great ideas on what this site can become, along with Paul Konyndyk doing great things in a multitude of areas, plus important contributions from Ricardo Cooney, Ron Armstrong, Crowley Sullivan and Tom Shanahan. (Rico Beard and Matt Dorsey, we still value your roles here, too, whatever you want those roles to be!)
Thank you for your support as we continue to pursue excellence here at SpartanMag.com. And let us welcome in Noah Sprunger on an official basis.
Sincerely,
Jim Comparoni
Publisher, SpartanMag.com
Fitzpatrick talks decision to transfer to Michigan State (link)
- Spartans Illustrated Message Board
- 15 Replies
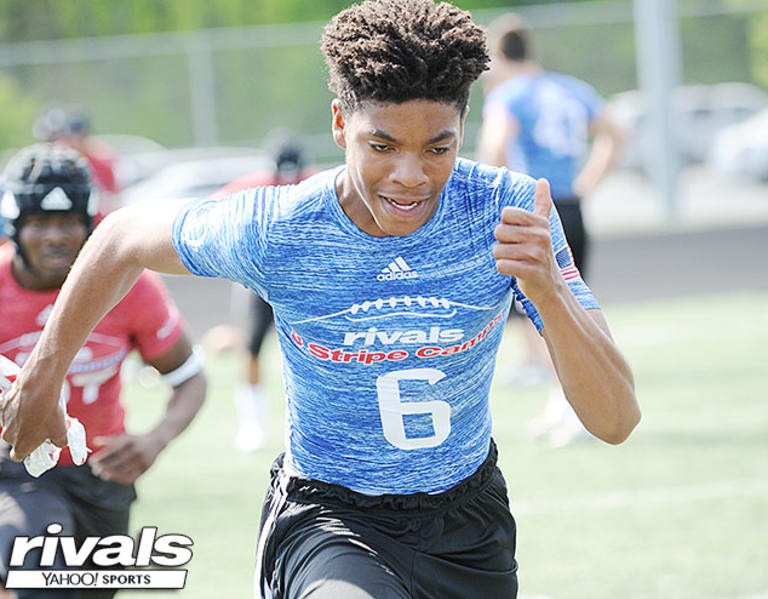
Christian Fitzpatrick reached out to Comparoni tonight to provide some insight on his decision to transfer from Louisville to Michigan State. He views Michigan State as a program on the rise, and he is looking forward to working with Courtney Hawkins. Fitzpatrick has four years of eligibility remaining.
 michiganstate.rivals.com

Fitzpatrick talks decision to transfer to Michigan State
Louisville transfer Christian Fitzpatrick explains his decision to join Mel Tucker's program.
Tucker offers clues on progress from first scrimmage (link)
- Spartans Illustrated Message Board
- 0 Replies
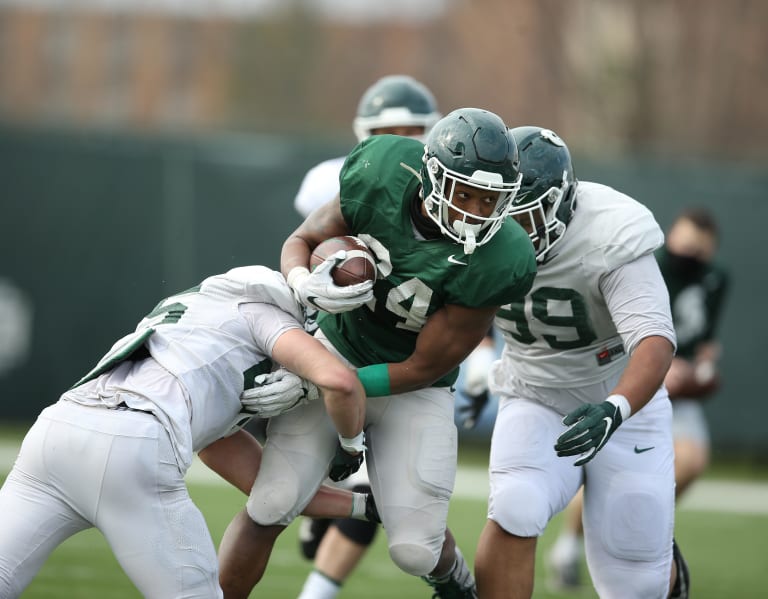
We didn't see the scrimmage and do not have stats from the scrimmage, but I do think we can read between the lines a little bit on the basis of Tucker's comments afterwards. Those comments were a lot more positive than some of the others that he made prior to the scirmmage.
Here is my take on his assessment:
 michiganstate.rivals.com
Here is my take on his assessment:

Tucker offers clues on areas of progress in first scrimmage
Based on Mel Tucker's comments after Saturday's scrimmage, it appears that Michigan is making progress in key areas.
'22 Center Dylan Lopez Offered (IMG)
- By haydenv8
- Spartans Illustrated Message Board
- 17 Replies
Login to view embedded media
Login to view embedded media
Currently committed to USC (no affiliation or posts on his Twitter profile), but not a bad idea to offer AJ Duffy's center.
I was thinking the other day that the staff never really pursued another center after missing out on Myslinski, and Samac going into his 3rd year of playing experience. Dantonio brought in Fincher in the '20 class but seems to be on the lighter side still. Will be interesting to monitor if Center is a position they look to bring in.
Panasiuk wants to go out on his own terms (link)
- Spartans Illustrated Message Board
- 2 Replies
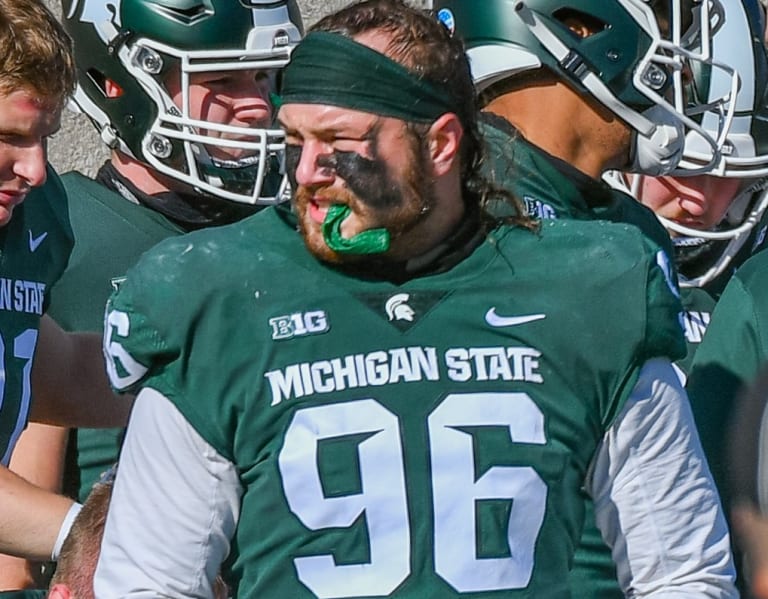
Good story from Rico Cooney on senior defensive end Jacub Panasiuk. Jim and I talked in the V-Cast last night about Panasiuk's ineffectiveness due to weight loss related to COVID-19. It explains a lot about the season that Panasiuk had last year.
 michiganstate.rivals.com

Panasiuk determined to go out his terms
Jacub Panasiuk is determined to write his own senior story after struggling with COVID-19 last season.
IMG wide receiver sets official visit date (link)
- Spartans Illustrated Message Board
- 0 Replies
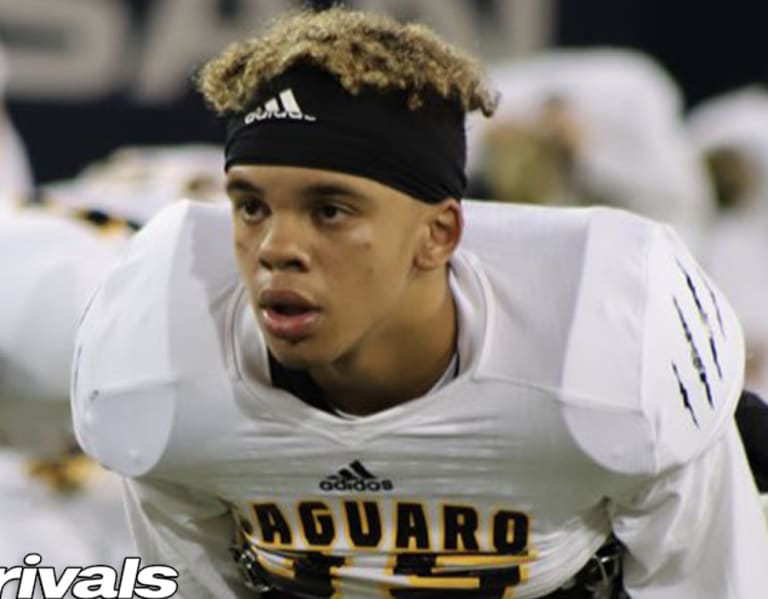
Kenny Jordan caught up with IMG receiver Shawn Miller, who has an official visit set for June 25.
Thanks Kenny
 michiganstate.rivals.com
Thanks Kenny

2022 WR Shawn Miller sets date for Michigan State official visit
IMG wide receivers WR Shawn Miller sets date for official visit to Michigan State.
HOCKEY Akito Hirose
- Spartans Illustrated Message Board
- 0 Replies
Anyone know if Cole recruited him? He’s taro’s younger brother a freshman at Minnesota state in the frozen four. Put up 1 goal and 12 assists. Pretty good for a frosh
D-line notebook: experienced, deeper d-line on the upswing
- Spartans Illustrated Message Board
- 6 Replies
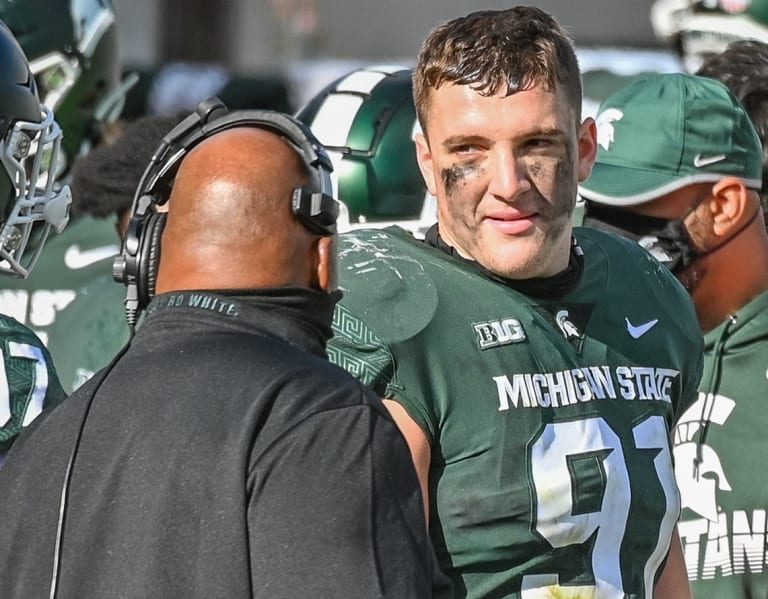
Here is my notebook on the MSU d-line.
Just having been around Ron Burton a lot during the past several years, I can tell you that he likes the pieces he has to work with on the d-line. That said, all of these coaches are just happy as heck just to be able to work with these guys hands-on. It's hard to coach footwork and hand placement in a Zoom call.
 michiganstate.rivals.com
Just having been around Ron Burton a lot during the past several years, I can tell you that he likes the pieces he has to work with on the d-line. That said, all of these coaches are just happy as heck just to be able to work with these guys hands-on. It's hard to coach footwork and hand placement in a Zoom call.

Experienced, deeper MSU d-line is on the upswing
Michigan State defensive line coach Ron Burton has high expectations for a position group that returns nearly everybody
Drew Jordan looking to be 'complete package' for MSU (link)
- Spartans Illustrated Message Board
- 1 Replies
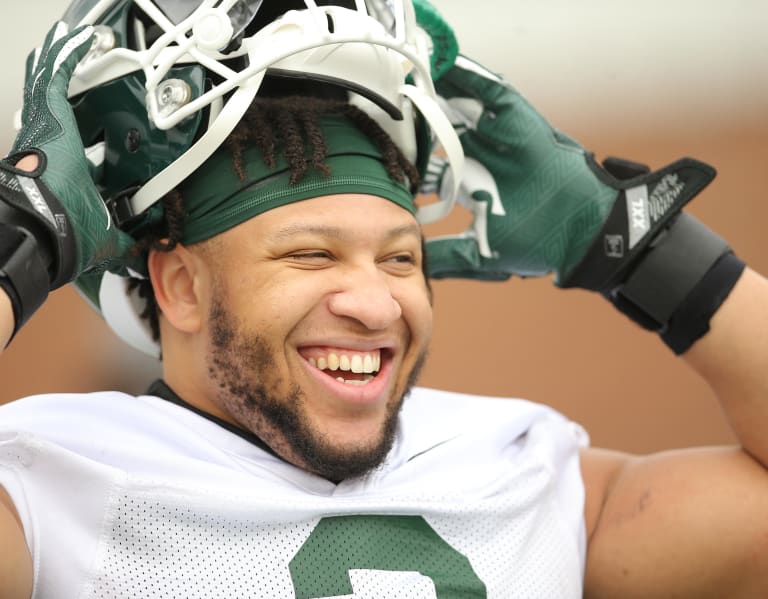
Here is a link to my story on Drew Jordan that is on the front page
 michiganstate.rivals.com

Jordan seeking to be 'complete package' at defensive end
East Lansing, Mich. – Defensive end Drew Jordan (6-3, 285) has drawn rave reviews from coaches and teammates alike as
Class of '22 Hypothetical
- Spartans Illustrated Message Board
- 21 Replies
Just to spark up some discussion on the matter, I want to provide a hypothetical class of '22 and see what everyone is thinking about how the class is going to end up. It will also be interesting to circle back to this next year. You can click on the names for their profile.
OFFENSE
AJ Duffy - ⭐⭐⭐⭐ Quarterback
Damari Alston - ⭐⭐⭐⭐ Running back
Owen Anderson - ⭐⭐⭐ Tight End
Tyrell Henry - ⭐⭐⭐ Wide Receiver (COMMITED)
Jaden Mangham - ⭐⭐⭐⭐ Wide Receiver
Kevin Thomas - ⭐⭐⭐⭐ Wide Receiver
Kristian Phillips - ⭐⭐⭐ Guard (COMMITED)
Gavin Broscious - ⭐⭐⭐ Guard (COMMITED)
Ashton Lepo - ⭐⭐⭐ Tackle (COMMITED)
Jacob Allen - ⭐⭐⭐⭐ Tackle
Kiyaunta Goodwin - ⭐⭐⭐⭐ Tackle
DEFENSE
Alex VanSumeren - ⭐⭐⭐⭐ Defensive Tackle
Anthony Lucas - ⭐⭐⭐⭐ Defensive Tackle
Dametrius Walker - ⭐⭐⭐ Defensive Tackle
Chase Carter- ⭐⭐⭐ Defensive End
Michael Williams - ⭐⭐⭐⭐ Defensive End
Wesley Bissainthe - ⭐⭐⭐⭐ Linebacker
Braydon Brus - ⭐⭐⭐ Linebacker
Malik Spencer - ⭐⭐⭐ Safety (COMMITED)
Trevon Howard - ⭐⭐⭐ Safety
Dillon Tatum - ⭐⭐⭐⭐ Defensive Back
Antonio Gates Jr. - ⭐⭐⭐ Defensive Back
TOTALS: 22
4-Stars: 11
3-Stars: 11
Thoughts? This is likely, almost certainly, not going to be the class we sign. However, I am wondering who you guys disagree with us taking, who you agree with taking, who you think we miss out on, who you think we land, etc.
Load more
ADVERTISEMENT
Filter
ADVERTISEMENT